Figure 4.

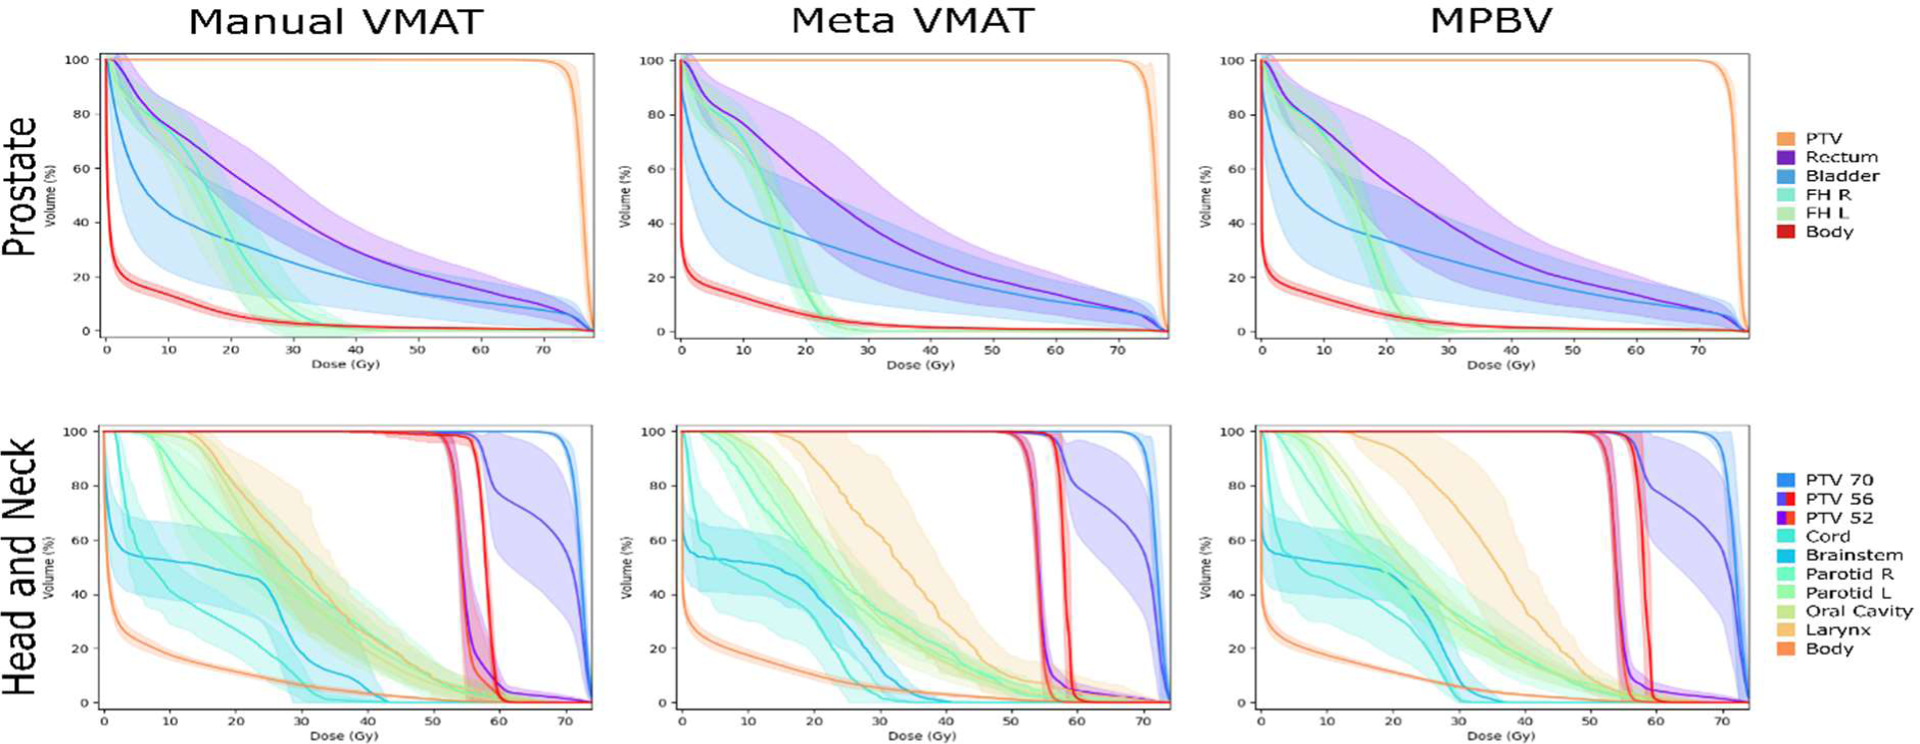
Visual comparison of the dose-volume histograms for both the prostate and head and neck datasets. Here, the means are shown as solid lines and the standard deviations are shown as error bands.

Visual comparison of the dose-volume histograms for both the prostate and head and neck datasets. Here, the means are shown as solid lines and the standard deviations are shown as error bands.