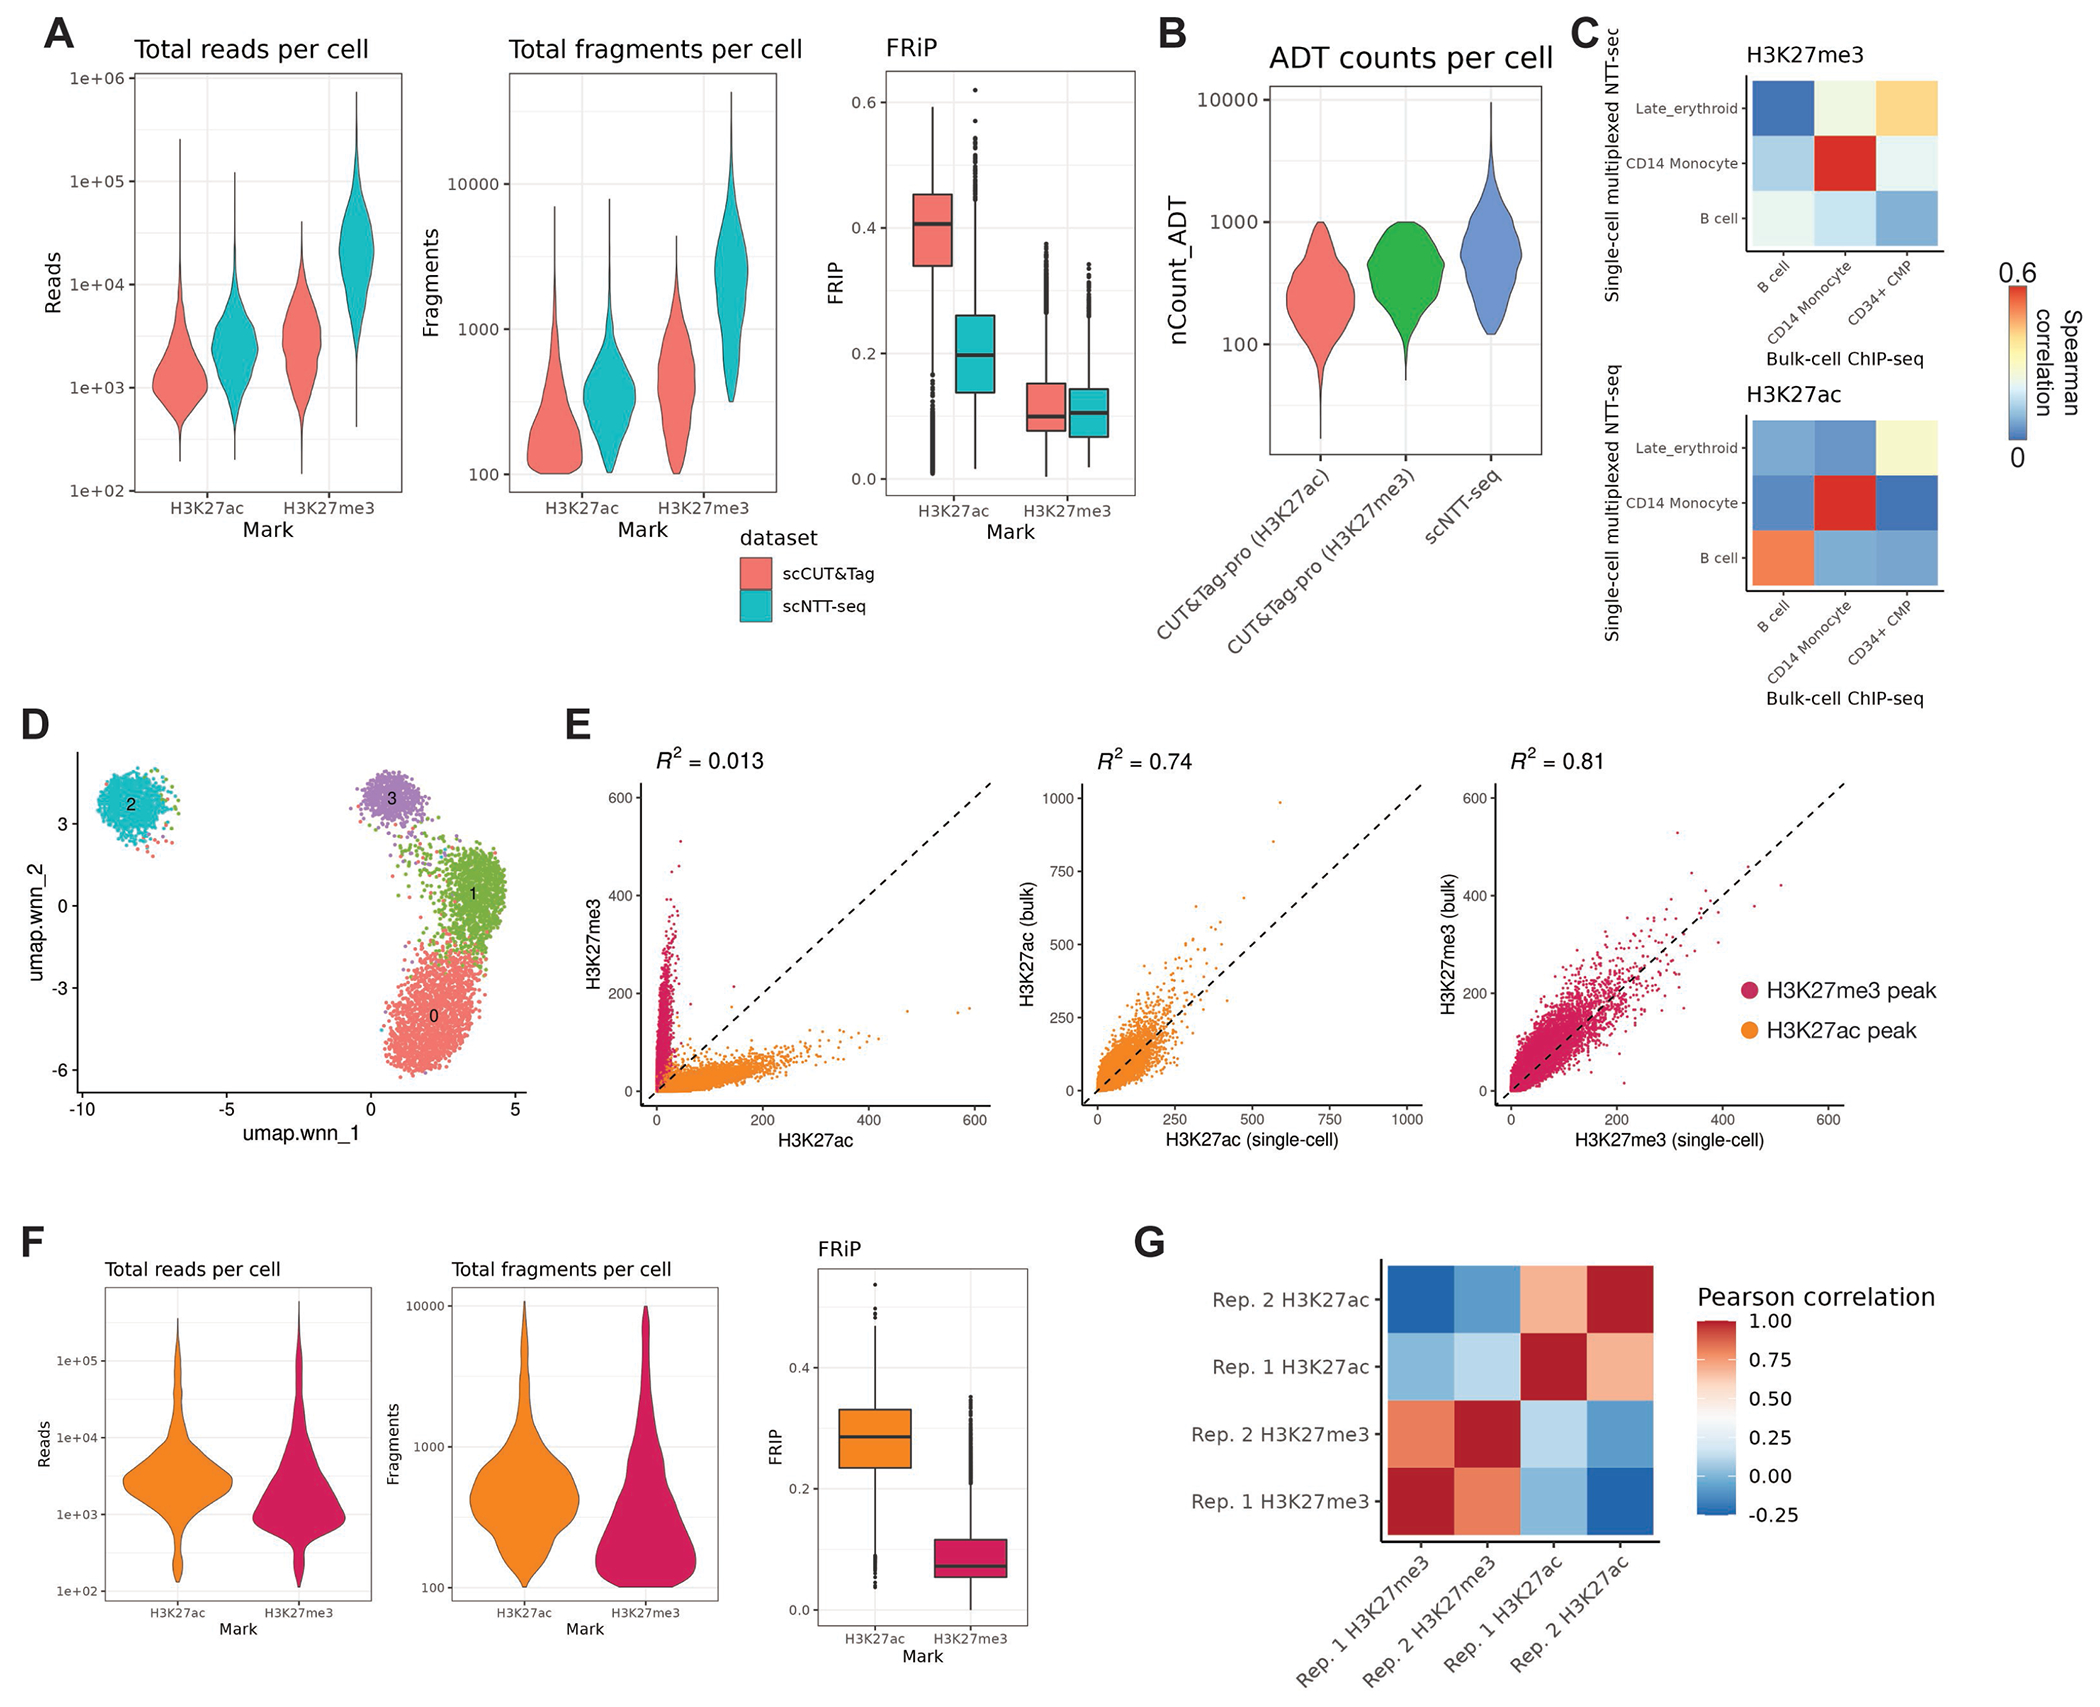
Extended Data Figure 3. Sensitivity and reproducibility of scNTT-seq.

A) Total read and fragment counts per cell and fraction of fragments in peaks (FRiP) for scCUT&Tag and scNTT-seq PBMC datasets. Box-plot lower and upper hinges represent first and third quartiles. Upper/lower whiskers extend to the largest/smallest value no further than 1.5x the interquartile range. Data beyond the whiskers are plotted as single points.
B) Comparison of total unique antibody-derived tag (ADT) counts sequenced per cell for CUT&Tag-pro (18) and scNTT-seq.
C) Spearman correlation between H3K27me3 counts (top) or H3K27ac counts (bottom) for cells profiled using multiplexed single-cell NTT-seq, or FACS-sorted bulk ChIP-seq profiled by ENCODE (17).
D) Two-dimensional UMAP projection and clustering for a second PBMC scNTT-seq replicate profiling H3K27me3 and H3K27ac. UMAP representation was constructed using both modalities, using the weighted nearest neighbors (WNN) method.
E) Scatterplots showing the number of fragment counts per H3K27me3 and H3K27ac ENCODE peak region for each assay profiled in the second PBMC scNTT-seq replicate dataset.
F) Total read and fragment count and FRiP distributions for H3K27me3 and H3K27ac assays profiled in the second PBMC scNTT-seq replicate dataset.
G) Pearson correlation between H3K27me3 and H3K27ac marks across PBMC scNTT-seq replicate datasets.
