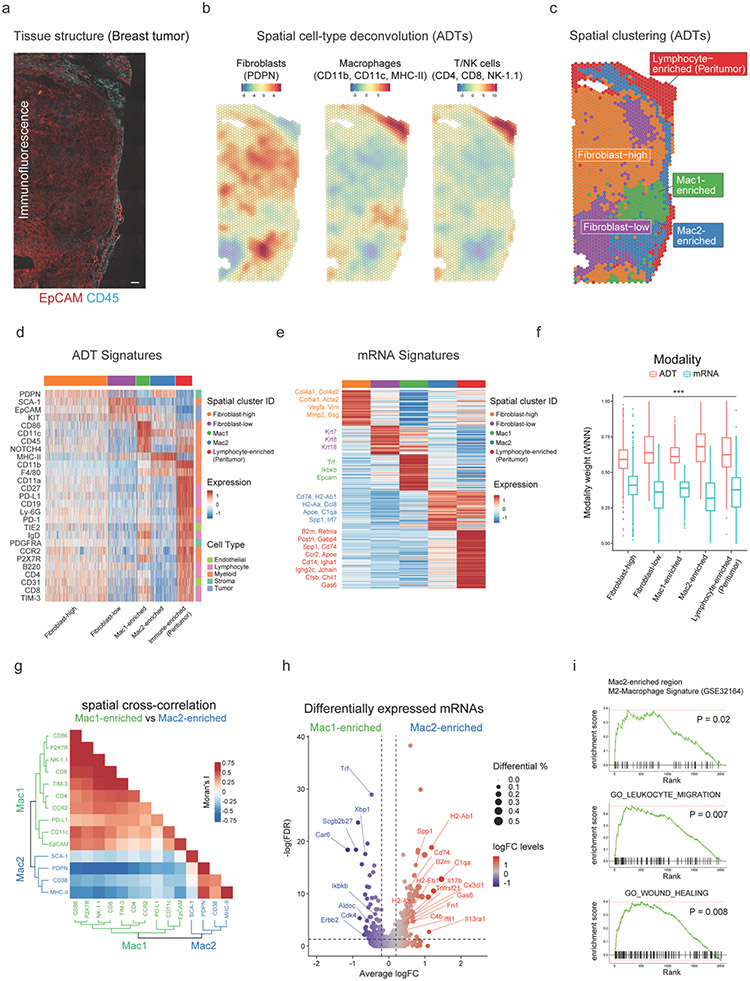
Figure 2: SPOTS reveals two spatially distinct macrophages in breast cancer TME.
(a) IF staining of EpCAM (red) and CD45 (cyan) in breast cancer tissue. Scale bar 200μm.
(b) Cell-type deconvolution based on ADTs (Z-score) of each spatial barcode overlaid onto the breast cancer tissue. Deconvolution values are provided in Supplementary Table 4.
(c) Spatial barcode clustering results with annotation of major cell type enrichment based on ADTs (Supplementary Table 4).
(d) Heatmap showing ADT signatures (Z-score) for each cluster (Supplementary Table 5).
(e) Heatmap showing the average expression levels (Z-score) of differentially expressed mRNAs for each cluster. Key marker genes are colored and highlighted. The complete list of differentially expressed mRNAs is listed in Supplementary Table 5.
(f) Boxplot showing relative contributions (WNN modality weights) to spatial clustering of mRNA and ADT modalities. Paired t-test, *p<0.05, **p<0.01, ***p<0.001, otherwise not significant (n.s).
(g) Heatmap showing the spatial cross-correlation (bivariate Moran’s I) of ADTs in Mac1- and Mac2-enriched regions with dendrograms showing hierarchical clustering of ADTs.
(h) Volcano plot showing log fold changes (logFC) of the top 5,000 most variable genes between Mac1- and Mac2-enriched spatial barcodes and their significance (y-axis; −log10 scale). Genes are dotted and colored by logFC levels (color scale). The size of the dot represents the difference in the fraction of detection between the two groups. Macrophage-related genes are annotated. P-values were determined by the Wilcoxon Rank Sum test. Vertical dotted lines represent ±0.2 logFC. Horizontal dotted lines represent false discovery rate (FDR) of 0.05 (−log10 scale). Raw and FDR corrected P-values and logFC values are listed in Supplementary Table 5.
(i) Gene Set Enrichment Analysis (GSEA) of Mac2-enriched spatial barcodes based on mRNA expression.

