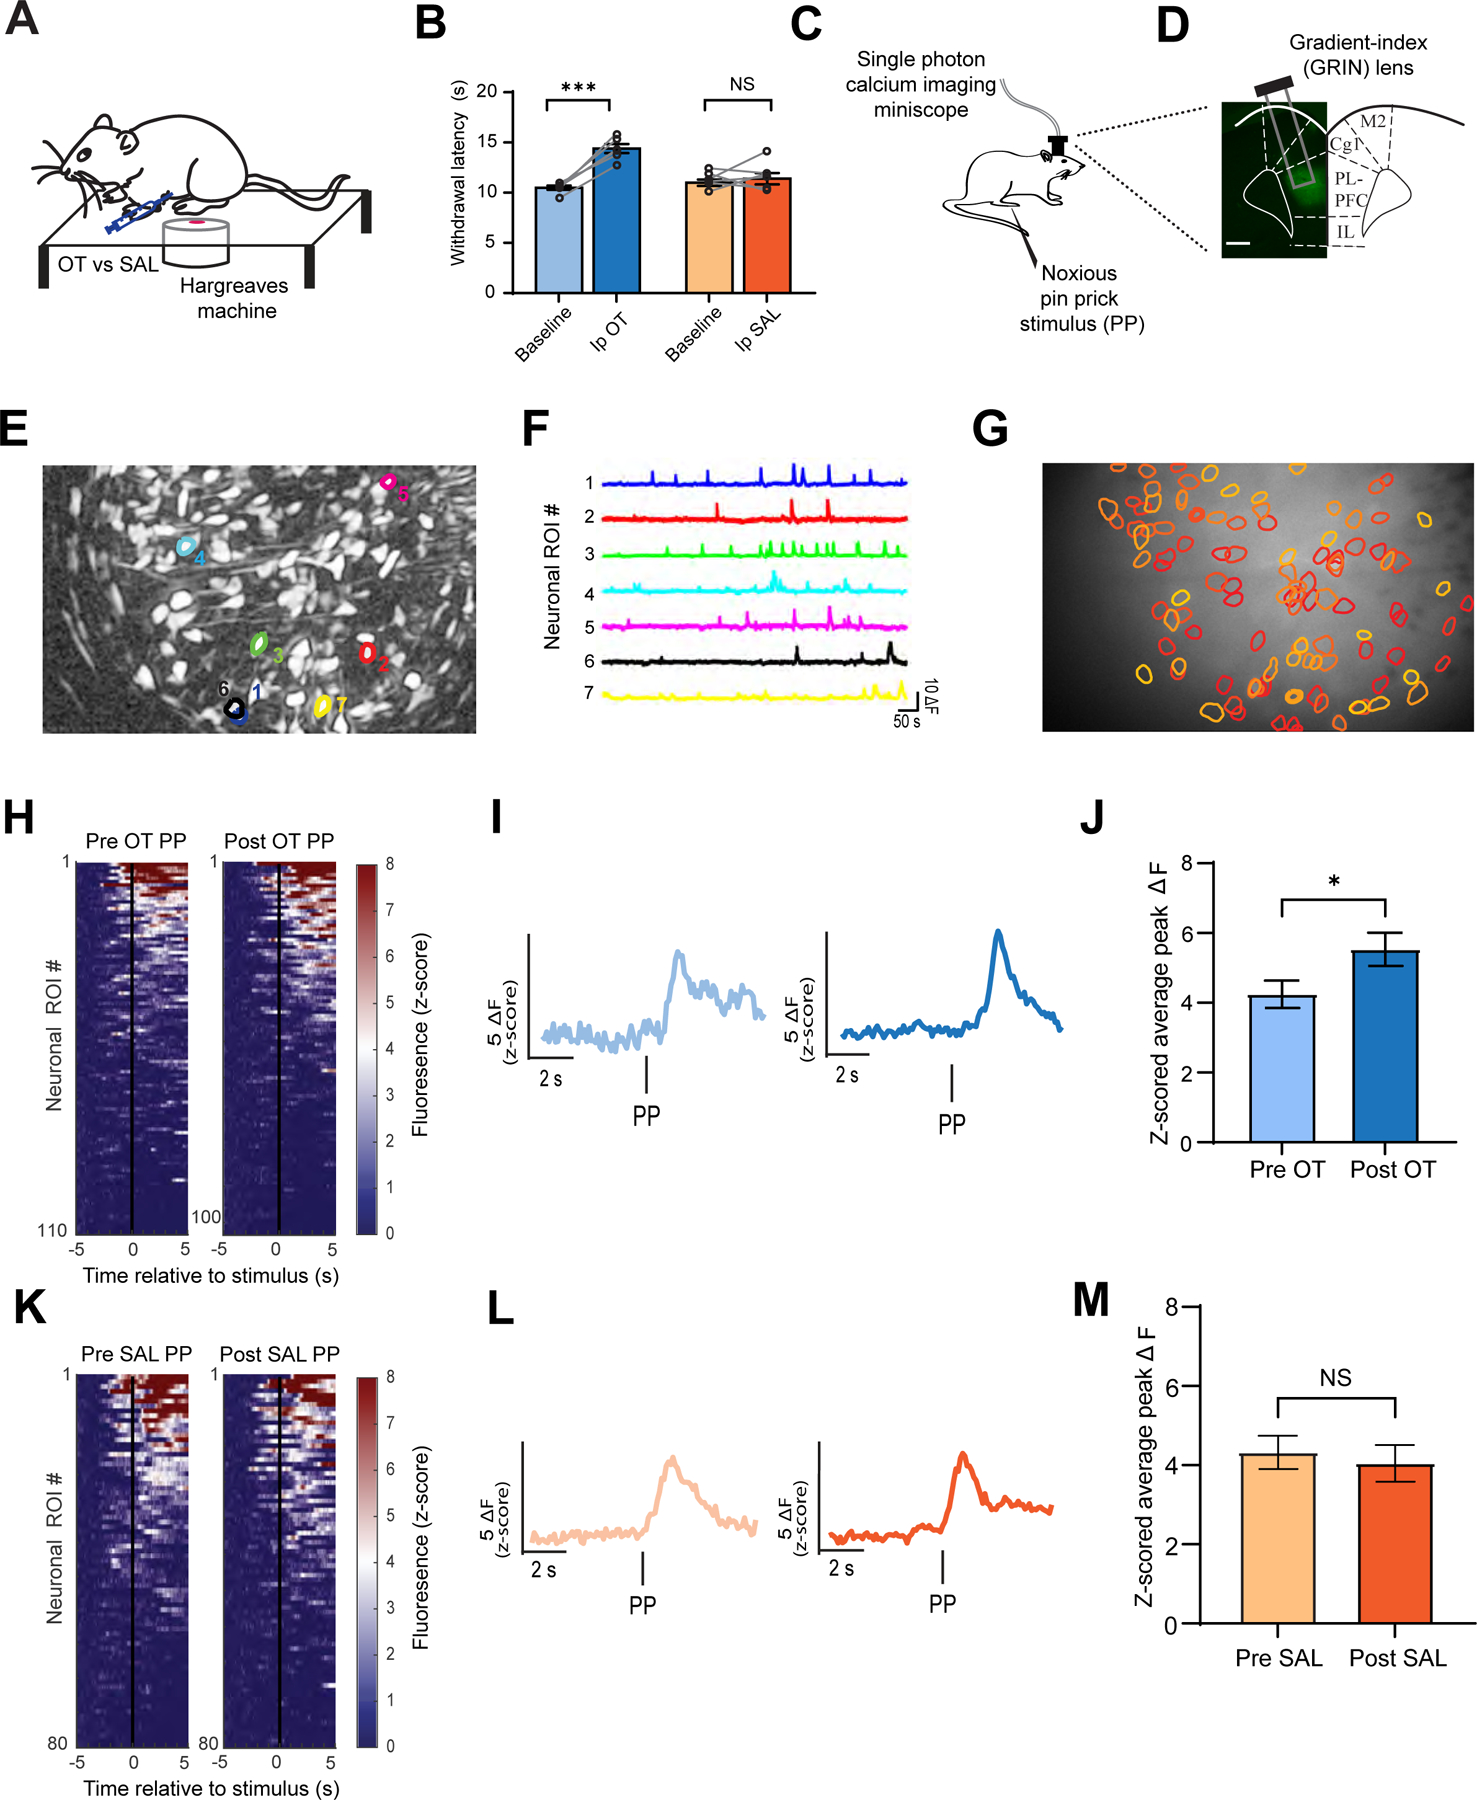
Figure 1. Oxytocin increases population nociceptive response in the PL-PFC.

(A) Hargreaves test on a rat injected intraperitoneally (Ip) with oxytocin (OT) or saline (SAL).
(B) Oxytocin prolonged the withdrawal latency. (paired t test; OT versus Baseline: ***p < 0.001; SAL vs Baseline: p = 0.5769; n = 6 animals).
(C) Schematic of calcium imaging experiments.
(D) Gradient-index (GRIN) lens placement and GCaMP6f expression in the PL-PFC.
(E) Field of view and sample identified contours of neuronal regions of interest (ROIs).
(F) Calcium activity of identified ROI traces.
(G) Map of PL-PFC ROIs with contours overlaid on imaging field of view.
(H) Mean Ca2+ response (z-scored) across all trials for all ROIs before and after OT. Neuronal activity is ordered from high to low responses after acute noxious pin prick (PP) stimulus. (n = 110 pre-OT, 104 post-OT ROIs).
(I) Representative trace of pain-responsive neuronal ROI in response to PP before (light blue) and after (blue) OT administration.
(J) Pain-responsive ROIs in the PL-PFC exhibit increased activity after OT (*p < 0.05, unpaired t test; n = 99 pre-OT, 97 post-OT ROIs).
(K) Same as (H), but before and after SAL (n = 80 pre-SAL, 84 post-SAL ROIs).
(L) Same as (I), but before (light orange) and after (orange) SAL.
(M) Pain-responsive ROIs in the PL-PFC displayed no change in activity after SAL. (p = 0.6596, unpaired t test; n = 100 pre-SAL, 82 post-SAL ROIs).
Data are represented as mean ± S.E.M. See also Figure S1, S2.
