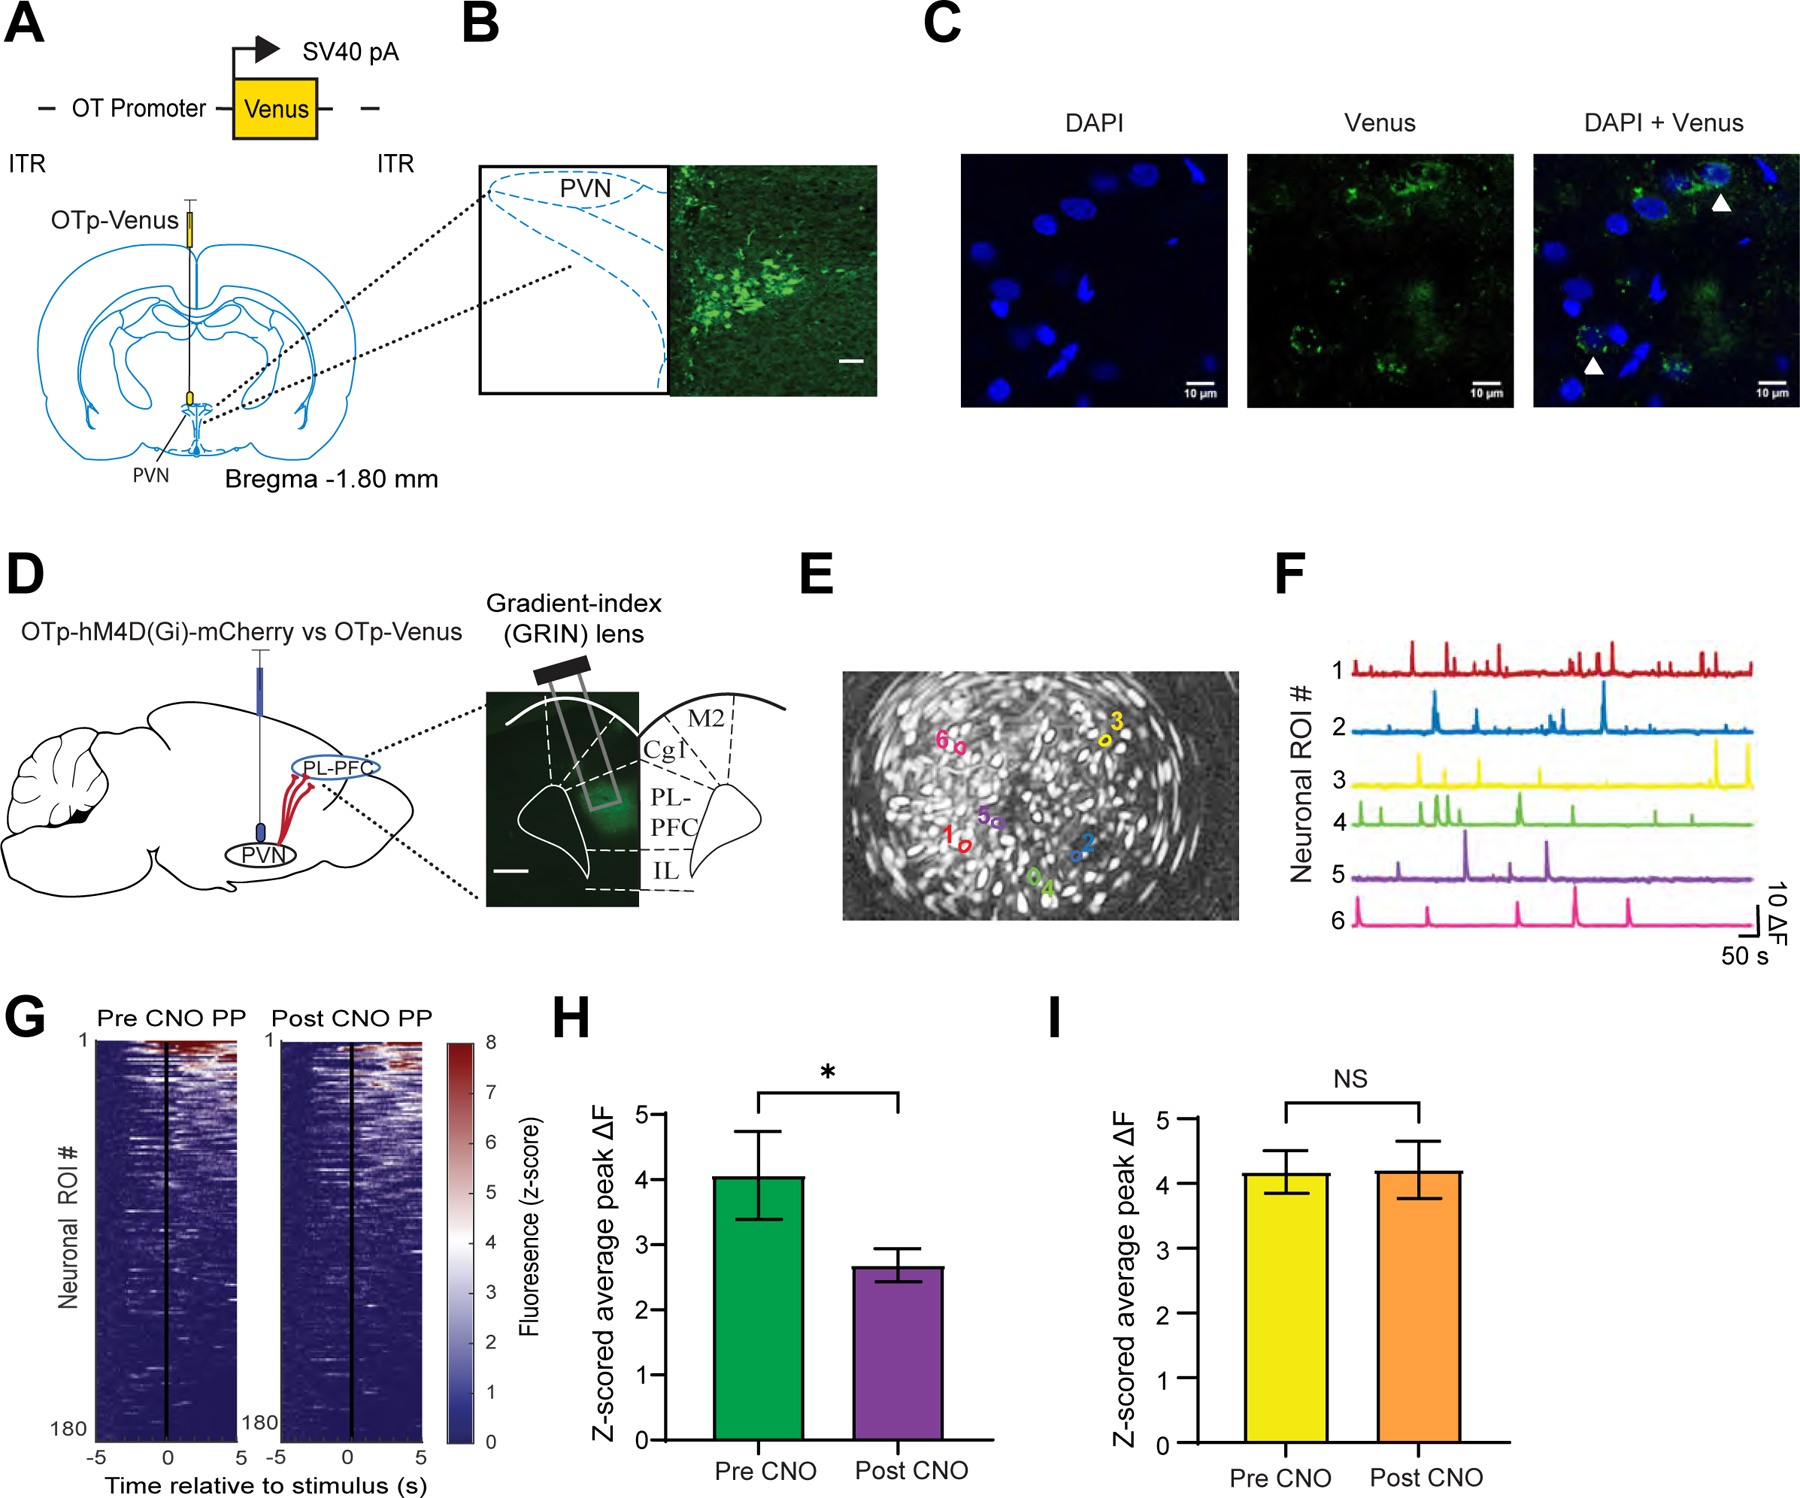
Figure 4. Chemogenetic inhibition of the PVN reduces the nociceptive response in PL-PFC.

(A) Viral vector and injection site of OTp-Venus in the PVN.
(B) Fluorescence imaging of PVN neurons.
(C) High-magnitude fluorescence imaging of PVN axons (white triangle) in the PL-PFC.
(D) OTp-hM4D(Gi)-mCherry or OTp-Venus virus injection in the PVN and Gradient-index (GRIN) lens placement and GCaMP6f expression in the PL-PFC.
(E) Field of view and map of example PL-PFC ROIs.
(F) Representative Ca2+ activity traces of ROIs in E.
(G) Mean Ca2+ response for PL-PFC ROIs imaged in sessions before and after CNO, ranked from high to low Ca2+ responses after PP. (n = 187 pre-CNO, 193 post-CNO).
(H) Pain-responsive ROIs in rats injected with OTp-hM4D(Gi)-mCherry exhibited decreased Ca2+ activity after CNO (*p < 0.05, unpaired t test; n = 39 pre-CNO, 52 post-CNO).
(I) Pain-responsive ROIs in rats injected with OTp-Venus showed no changes in Ca2+ activity after CNO (p = 0.9541, n = 47 pre-CNO, 58 post-CNO).
Data are represented as mean ± S.E.M.
