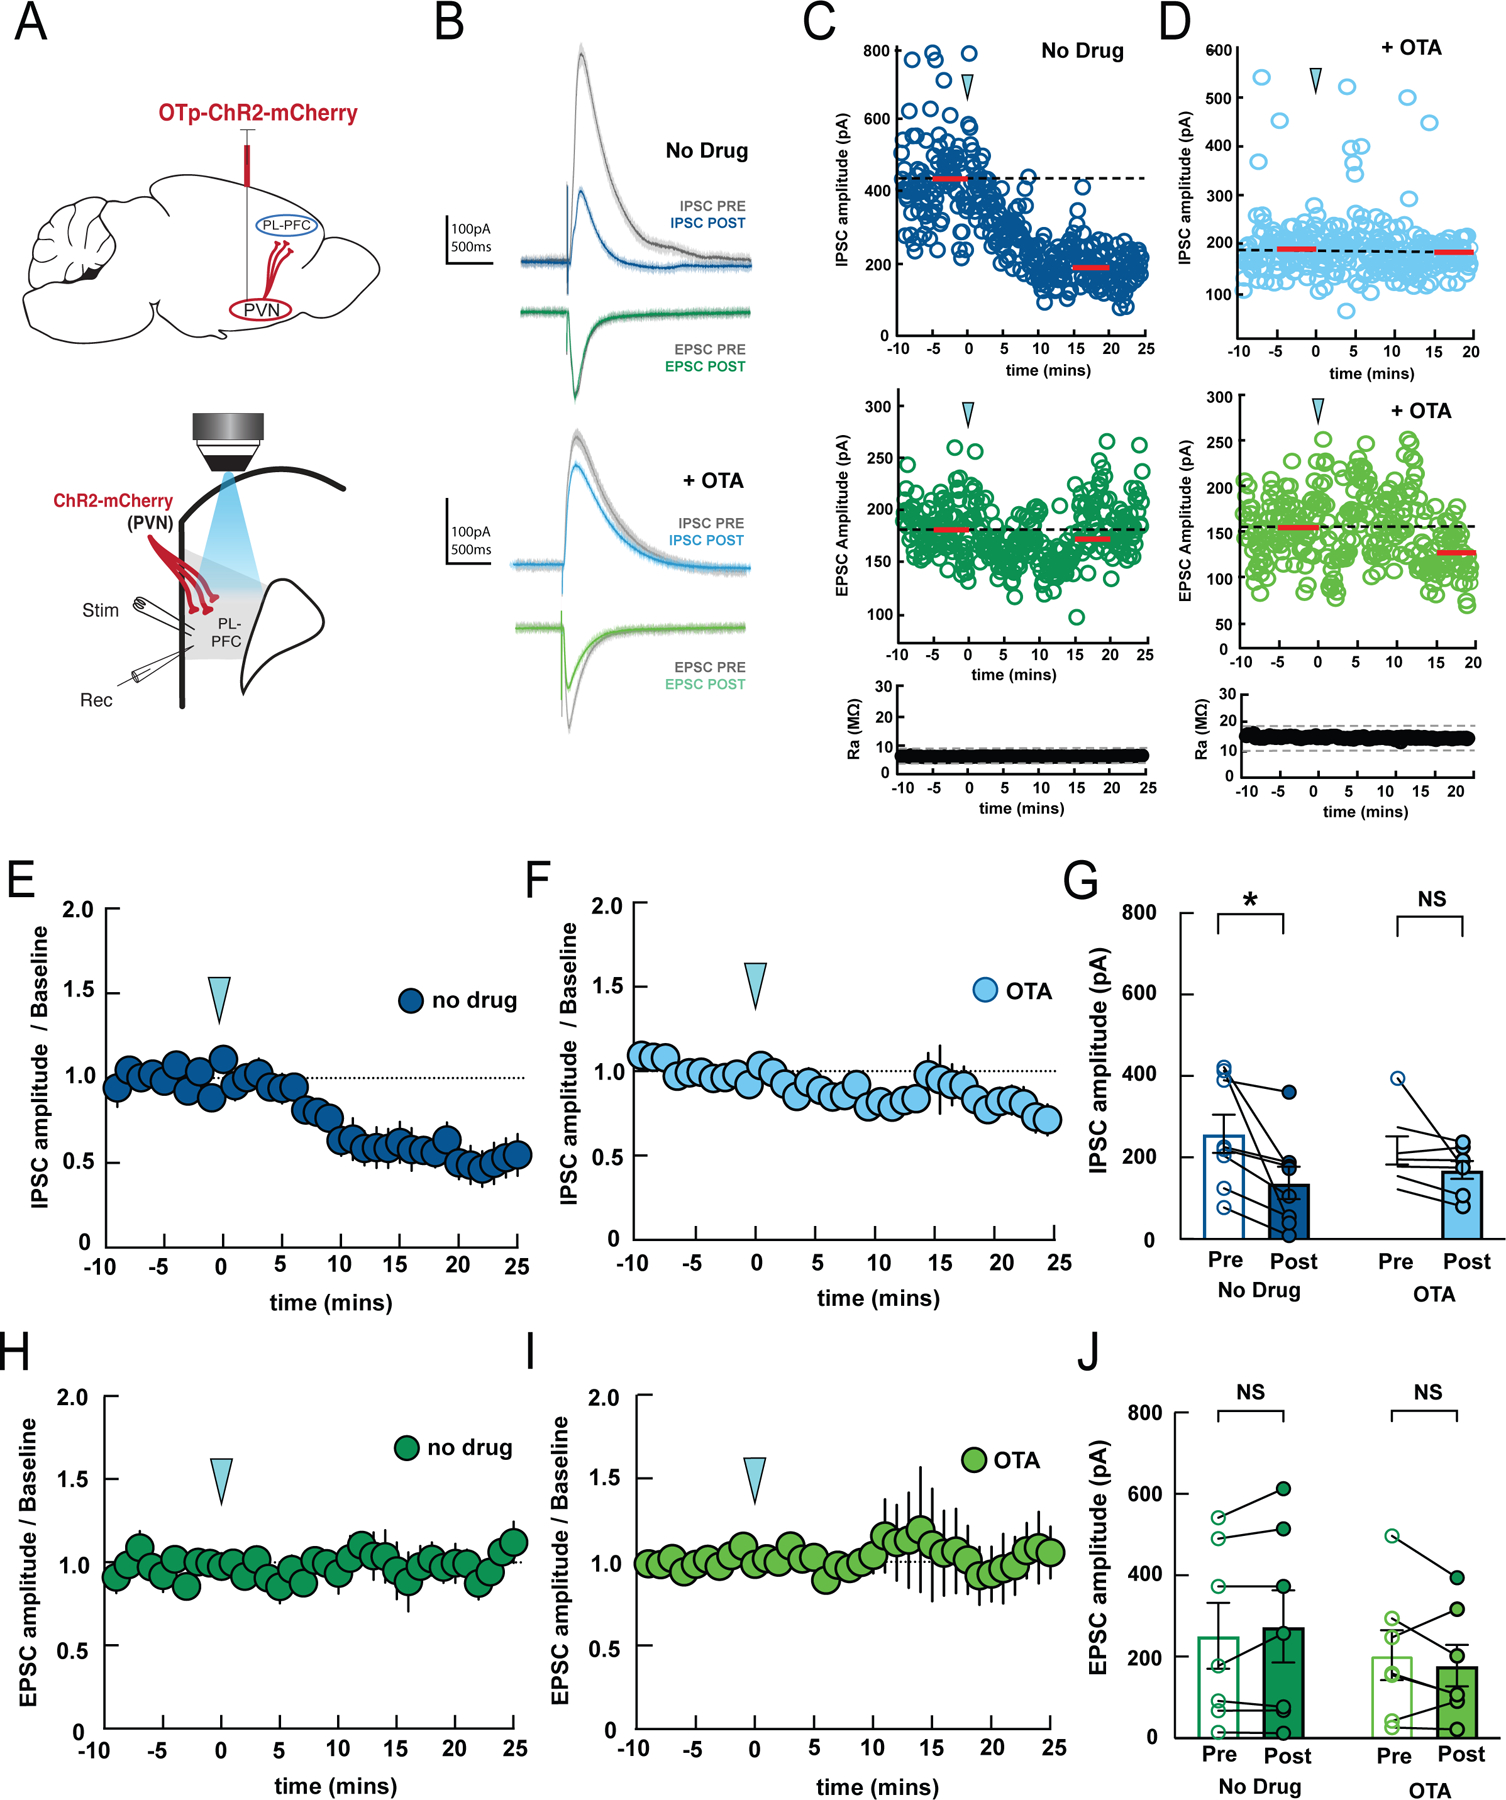
Figure 5. Optogenetic activation of the PVN axon terminals reduces synaptic inhibition in the PL-PFC.

(A) Surgical (top) and recording (bottom) configurations. Blue light stimulation of ChR2-expressing PVN terminals in PL-PFC alters magnitude of post-synaptic currents evoked by local electrical stimulation (stim) recorded in whole-cell configuration (rec).
(B) Example IPSC and EPSC before (gray, baseline) and after optogenetic PVN stimulation (blue, IPSC 15–20 minutes post-stimulation; green, EPSC 15–20 minutes post-stimulation).
(C) Example recording showing time course of PVN stimulation (arrowhead) on IPSC amplitudes (top) and EPSC amplitudes (middle) from the same cell. Red bars, time windows for statistical analysis. Bottom, Ra was stable over the recording period; dashed lines, ±20% from average of baseline Ra.
(D) Example recording showing time course of PVN stimulation with 1 µM OTA in bath; IPSCs, EPSCs, Ra were unaffected. (E,F) Summary of time course of effects of PVN stimulation (arrowhead) on IPSCs in ACSF (E, n=8 recordings) or 1 µM OTA (F, n=7 recordings) added to the bath.
(G) Mean IPSC amplitudes during 5-minute baseline (Pre) and 15–20 minutes after optogenetic stimulation (Post). IPSCs were reduced by PVN stimulation in ACSF (‘No Drug’, p = 0.0128, two-way ANOVA with Bonferroni’s multiple comparisons correction, n=8 recordings), but blocking oxytocin receptors prevented this effect (‘OTA’, p=0.50, n=7 recordings). (H,I) Summary of time course of EPSCs after PVN stimulation in ACSF (left) or 1 µM OTA (right).
(J) Mean EPSC amplitudes before and after PVN stimulation; no effect in either ACSF (p=0.57) or 1 µM OTA (p=0.46). Same cells as in (G).
Data are represented as mean ± S.E.M.
