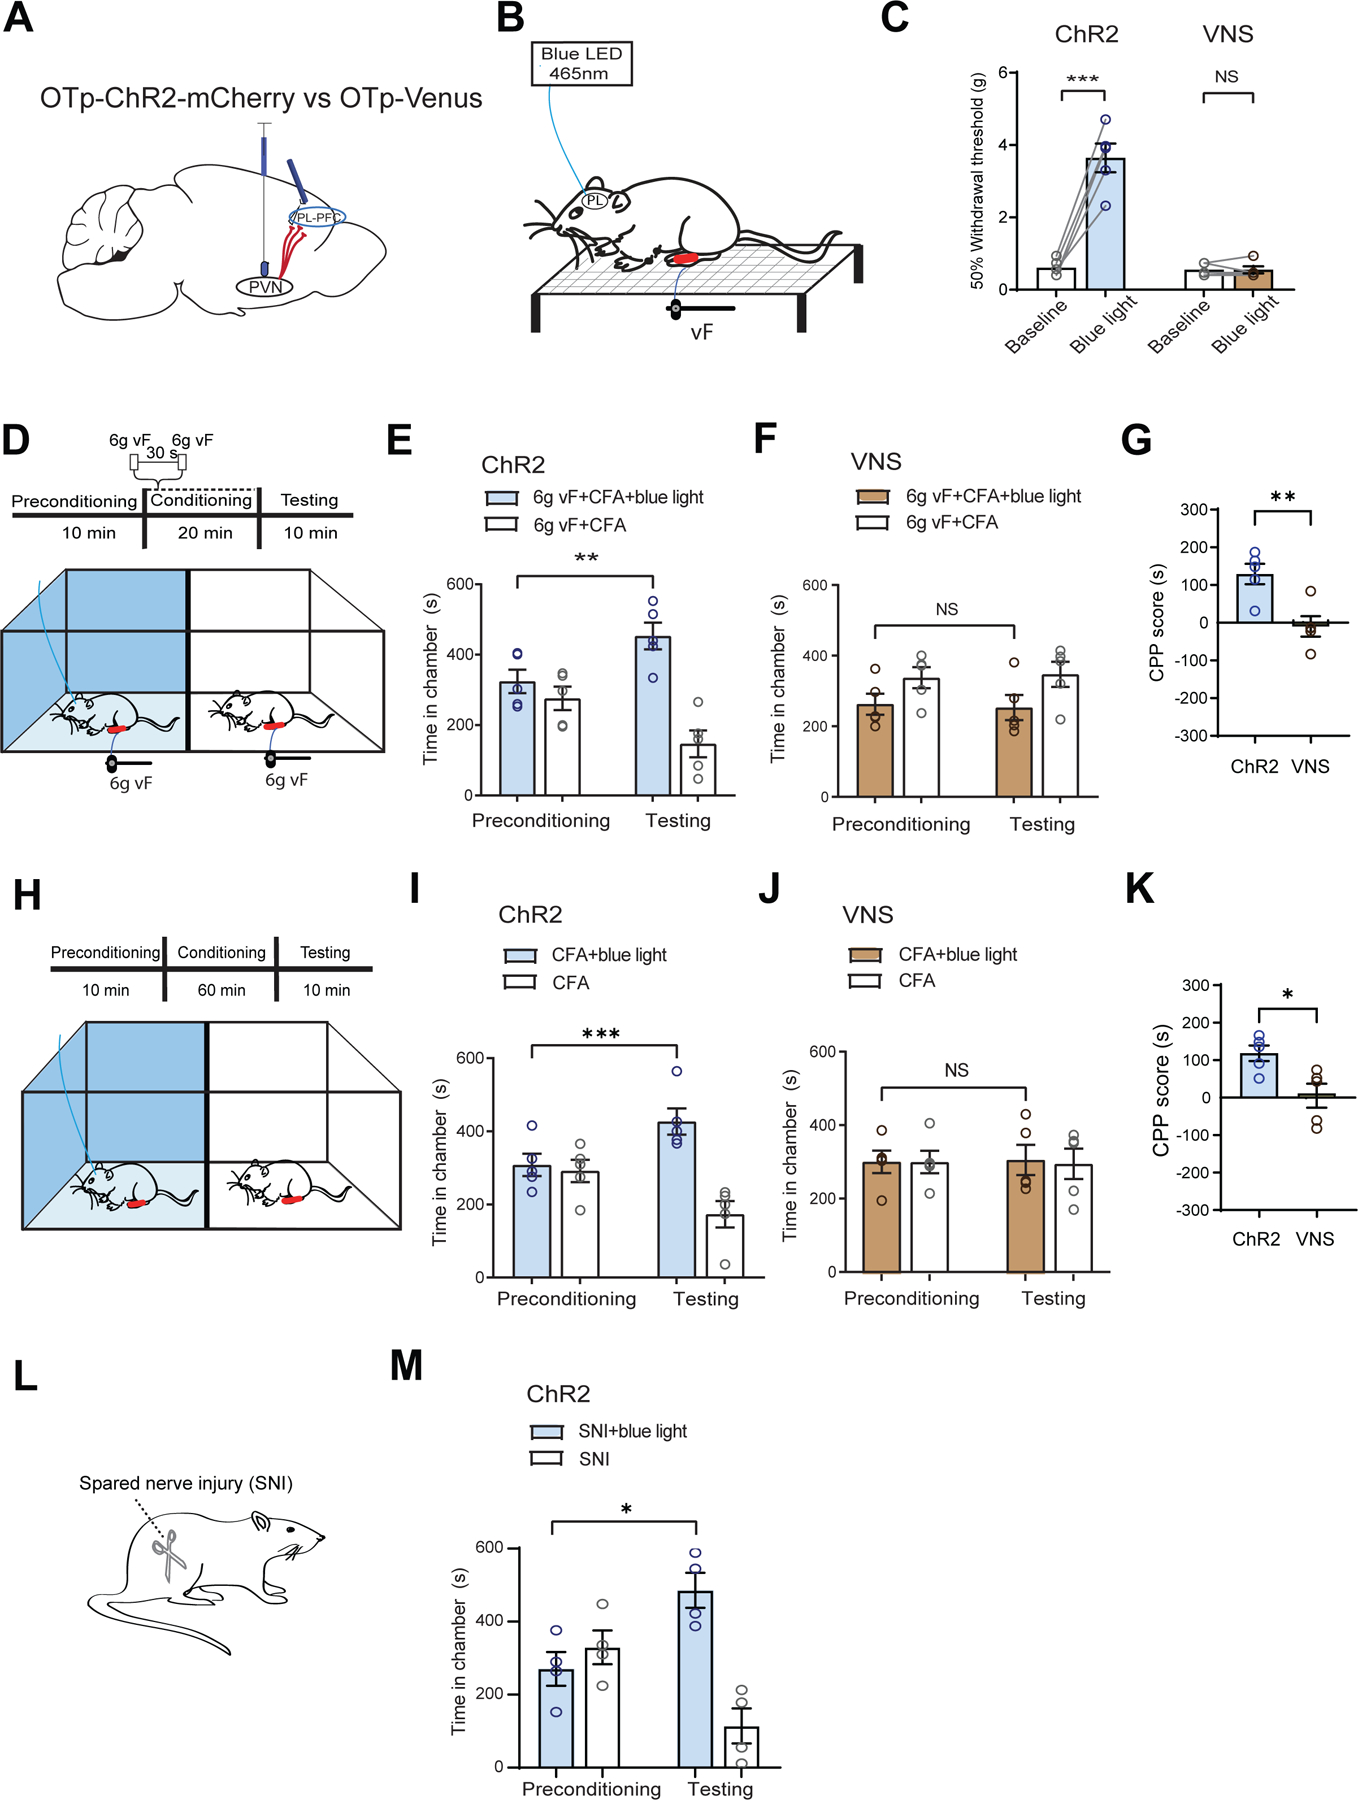
Figure 8. Activation of axon terminals of oxytocinergic neurons from the PVN in the PL-PFC inhibits chronic pain.

(A) Injection of OTp-ChR2-mCherry or OTp-Venus into the PVN and optic fiber into the PL-PFC.
(B) Schematic of mechanical allodynia.
(C) Light treatment of the PL-PFC increased withdrawal threshold in CFA-treated ChR2 (blue) rats, compared with VNS (control) rats. (paired t test; ChR2 versus baseline: ***p < 0.001; VNS versus baseline; p = 0.9911; n = 5 ChR2 and VNS animals).
(D) CPP assay in CFA-treated rats. In one chamber, rats received noxious mechanical stimulus (6g vF) paired with light treatment of the PL-PFC. In the other chamber, rats received 6g vF alone.
(E) ChR2 rats showed preference for the chamber paired with light treatment (**p < 0.01, two-way ANOVA with repeated measures and Sidak’s multiple comparisons test; n = 5 ChR2 animals).
(F) VNS rats showed no preference for either chamber (p = 0.9242, n = 5 VNS animals).
(G) ChR2 CFA-treated rats showed preference for optogenetic activation of the PVN-PFC pathway in the presence of 6g vF (**p < 0.01, unpaired t test; n = 5 ChR2 and VNS animals).
(H) CPP assay in CFA-treated rats experiencing tonic pain. Rats received light activation of PL-PFC in one chamber and no treatment in the opposite chamber.
(I) ChR2 CFA-treated rats showed preference for the chamber paired with light treatment (***p < 0.001, two-way ANOVA with repeated measures and Sidak’s multiple comparisons test; n = 5 ChR2 animals).
(J) VNS CFA-treated rats showed no preference for either chamber (p = 0.9845, n = 5 VNS animals).
(K) ChR2 rats experiencing tonic pain showed preference for optogenetic activation of the PVN-PFC pathway (*p < 0.05, unpaired t test; n = 5 ChR2 and VNS animals).
(L) Spared-nerve injury (SNI) model.
(M) ChR2 rats after SNI preferred the chamber paired with light stimulation of the PVN-PFC projection (*p < 0.05, n = 4 ChR2 animals).
Data are represented as mean ± S.E.M.
