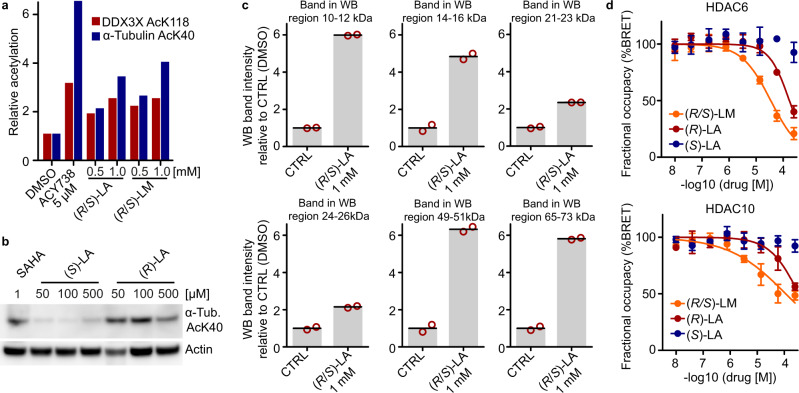
Fig. 3. (R/S)-lipoic acid and (R/S)-lipoamide lead to hyperacetylation of HDAC substrates in cells.
a Western blot analysis of acetylation levels of HDAC6 substrates following 12 h treatment of HEK293T cells with (R/S)-LA, (R/S)-LA, and the HDAC6 inhibitor ACY738 (see also Supplementary Fig. 3a). b Western blot for α-Tubulin AcK40 acetylation levels after 12 h treatment of A549 cells with SAHA (Vorinostat), (R)-LA, and (S)-LA. c Western blot analysis for global lysine acetylation levels of HeLa S3 cells treated with (R/S)-LA (16 h; n = 2 independent biological experiments, error bars represent standard deviation; see also Supplementary Fig. 3c). The histograms show hyperacetylation of proteins in the size range of established HDAC substrates, such as Histones (11–16 kDa), Peroxiredoxin (22 kDa)20, α-Tubulin (50 kDa), and others. d HDAC6 and HDAC10 nano-BRET assays demonstrating in-cellulo target engagement in HEK293T cells (n = 3 independent experiments, data are represented as mean value ± SD; curve fitted with a variable slope; bottom constrained to 0 and top constrained to 100). Source data are provided as a Source Data file.

