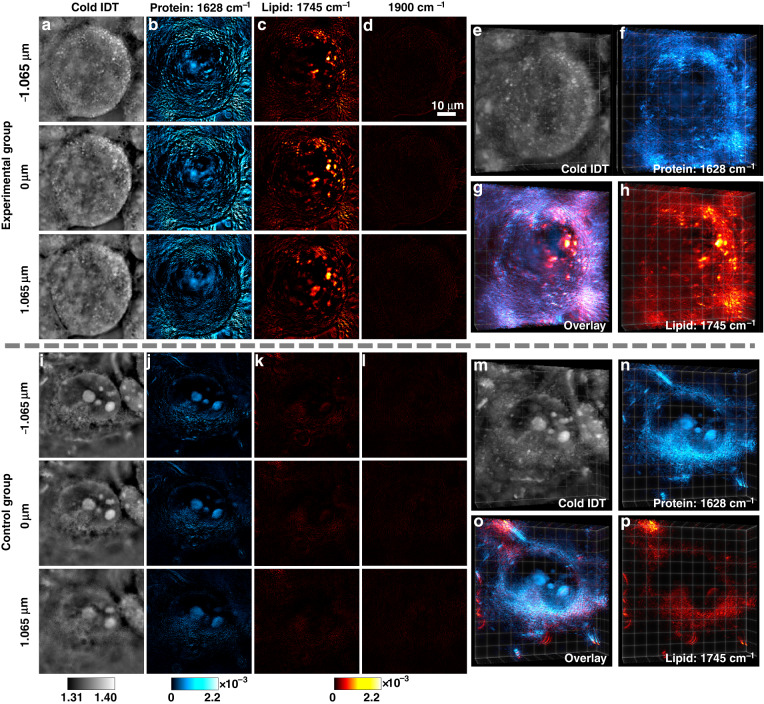
Fig. 3. FBS-IDT chemical imaging on human epithelial cells (Tau RD P301S FRET Biosensor cells).
a–h 3D chemical imaging of the experimental group with fibrillar tau aggregates. i–p 3D chemical imaging of the control group without fibrillar tau aggregates. The fixed cells for both groups are immersed in D2O PBS. The scale bar in (d) is applicable to (a–d) and (i–l). a, i Depth-resolved cold imaging results. b, j Protein imaging results with 1628 cm−1 mid-IR wavenumber. c, k Lipid imaging results with 1745 cm−1 mid-IR wavenumber. The wavenumber at 1745 cm−1 corresponds to the peak of the lipid ester C = O58,90,91. d, l Off-resonance imaging results with 1900 cm−1 mid-IR wavenumber. Most biochemical compounds have significantly weak or no absorptions at this cell-silent wavenumber. e, f, h 3D rendering of the cells in the experimental group shown in (a–c). g Overlay chemical imaging results of (f) and (h). m, n, p 3D rendering of the cells in the control group shown in (i–k). o Overlay chemical imaging results of (n) and (p). Extended data can be found in Fig. S1 in the Supplementary Information

