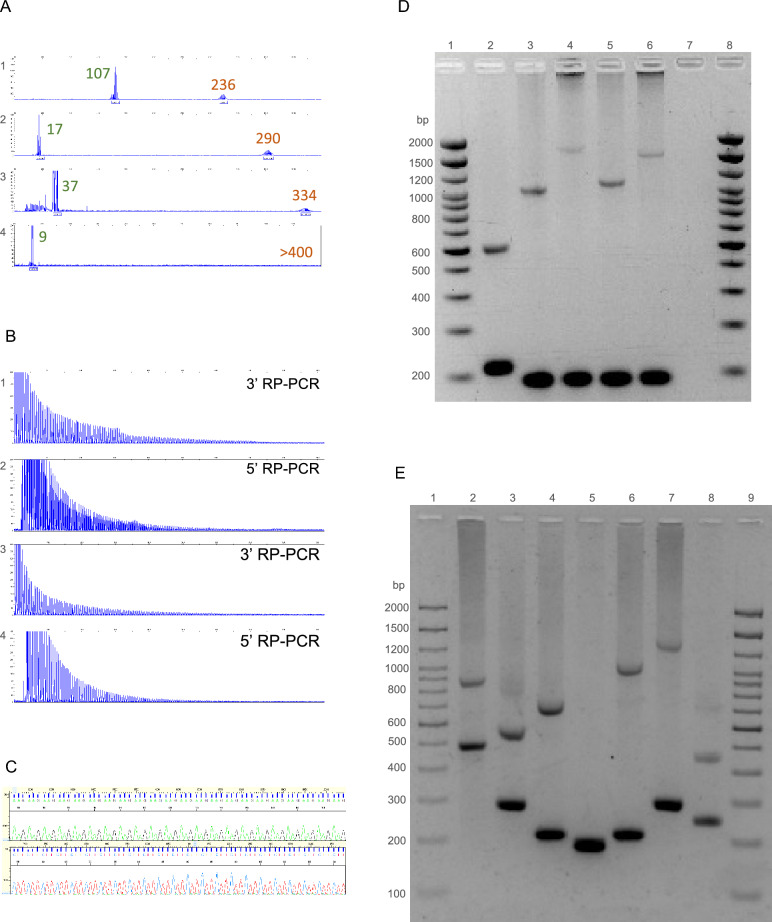
Figure 2.
Molecular analysis of the FGF14 repeat locus. (A) Fluorescent long-range PCR of the FGF14 repeat locus of four patients with late-onset cerebellar ataxia. The calculated number of repeat units of each allele (before correction) is indicated for each of the four patients. (B) 5′ RP-PCR and 3′ RP-PCR of the FGF14 repeat locus of two patients carrying a (GAA)≥250 repeat expansion in FGF14. (C) Sanger sequencing of a patient carrying a (GAA)≥250 repeat expansion showing GAA repeats: (GAA)n on forward strand and (TTC)n on reverse strand. (D) Agarose gel electrophoresis (1.5%), lanes 1 and 8: 2,000 bp molecular weight marker, 2: 17/132 repeat units, 3: 9/284 repeat units, 4: 9/510 repeat units, 5: 9/313 repeat units, 6: 9/467 repeat units, and 7: negative control. (E) Agarose gel electrophoresis (1.5%), lanes 1 and 9: 2,000 bp molecular weight marker, 2: 107/236 repeat units, 3: 40/132 repeat units, 4: 16/182 repeat units, 5: 8/9 repeat units, 6: 17/319 repeat units, 7: 43/370 repeat units, and 8: 28/94 repeat units. Agarose gels were imaged with the Uvidoc HD6 Gel Documentation System using the default UV-Gel settings in the Uvitec-1D software, which resulted in overexposure. The gels presented in D and E were cropped for clarity of presentation. The original gels are presented in Supplementary Fig. S10.

