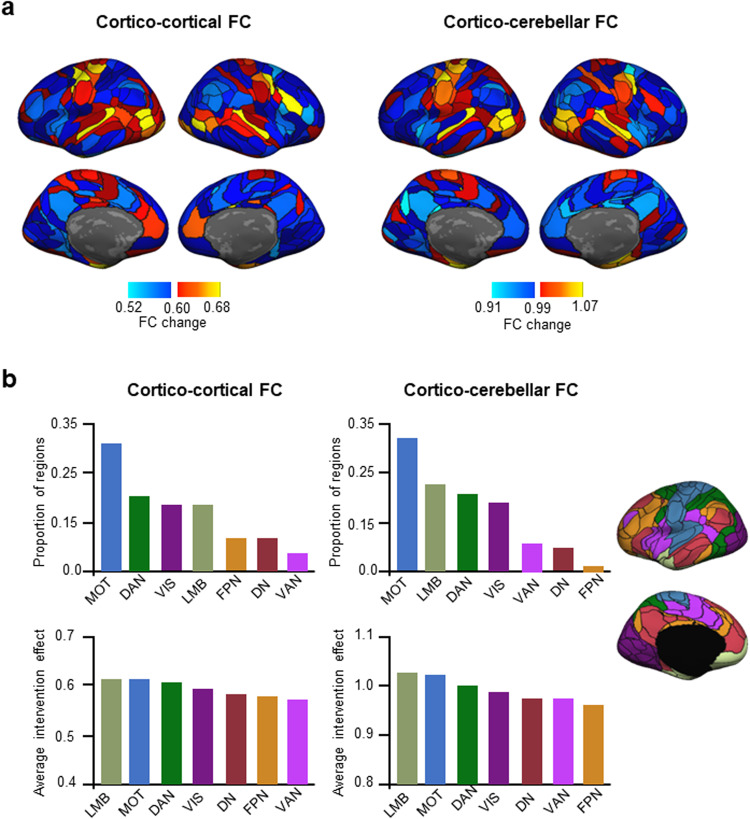
Fig. 4. The motor, limbic, and visual large-scale functional networks are most affected by the VIM lesion.
a We investigated cortico-cortical (left) and cortico-cerebellar (right) functional connectivity to determine which regions exhibited an intervention effect, i.e., regions whose functional connectivity substantially changed from pre- to post-intervention. Regions in warm colors demonstrated an above-average intervention effect. The color bar indicates FC change, which was calculated as the dissimilarity between pre- and post-FC profiles while controlling for intra-individual variability (see Methods), with the middle value representing the mean. b Cortical regions were divided into the seven canonical large-scale functional networks (depicted on the right). The networks with the highest proportion of regions exhibiting an intervention effect at the level of cortico-cortical FC were the MOT, DAN, VIS, and LMB networks (top left panel). The average intervention effect of each network was calculated. The networks that demonstrated the largest average intervention effect in terms of their cortico-cortical FC were the LMB, MOT, DAN, and VIS networks (bottom left panel). In terms of cortico-cerebellar FC, the networks with the highest proportion of regions demonstrating an intervention effect were the MOT, LMB, DAN, and VIS networks (top right panel). The highest average intervention effect was found in the LMB, MOT, DAN, and VIS networks (bottom right panel). MOT sensorimotor network, DN default network, LMB limbic network, VIS visual network, VAN ventral attention network, DAN dorsal attention network, FPN frontoparietal network.

