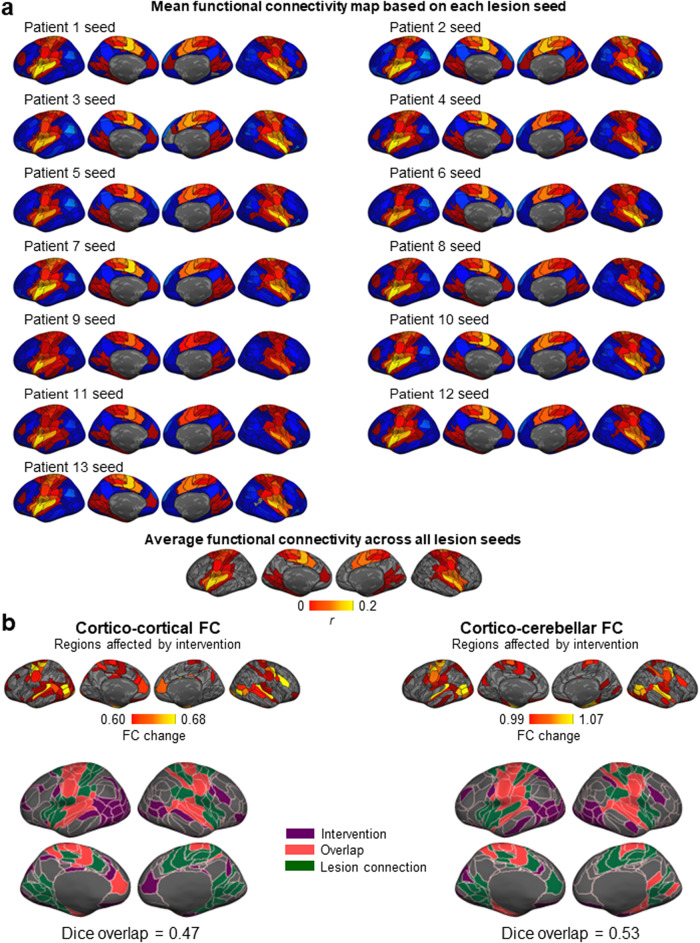
Fig. 5. Regions functionally connected to the lesion sites exhibited a change in their functional connectivity following the intervention.
a Functional connectivity of the lesion site. The lesion site of each patient was used as a seed to generate a functional connectivity map, based on data from the control group (N = 48). The resulting FC maps are shown for each lesion site. The average FC map, across all 13 seeds, is shown at the bottom. The color bar represents FC strength (Pearson r). b The cortical maps depict the cortical regions whose functional connectivity substantially changed from pre- to post-intervention, according to their cortico-cortical (middle left panel) and cortico-cerebellar (middle right panel) functional connectivity. The color bar indicates FC change, and only values above the mean are shown. We then calculated the extent of overlap between the regions connected to the lesion sites and the regions that demonstrated an intervention effect. The overlap was Dice = 0.47 for cortico-cortical connections (bottom left panel), and Dice = 0.53 for cortico-cerebellar connections (bottom right panel). These substantial overlaps indicate that the functional reorganization that occurred after the intervention mainly affected the regions that are functionally connected to the lesion sites.

