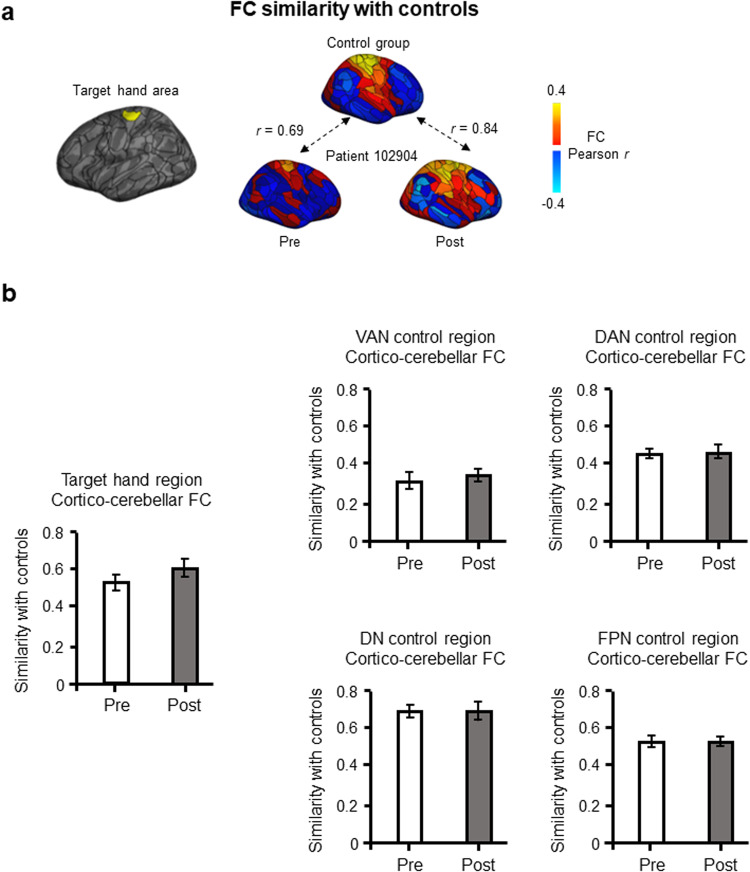
Fig. 7. Cortico-cerebellar FC similarity before and after the intervention.
a The left hemisphere hand region is highlighted on a cortical map (left). For each patient, we calculated the similarity in functional connectivity patterns between their cortical target hand region and the control group’s left hemisphere hand region, before and after the MRgFUS intervention. An example is shown for a randomly chosen patient, whereby the FC similarity is r = 0.69 before the intervention, and r = 0.84 after the intervention. The increased similarity from pre- to post-intervention indicates a normalization of the target hand region’s functional organization following VIM lesioning. b We averaged the FC similarity for the target hand region across patients at each time point. There was a non-significant trend of increase in cortico-cerebellar FC similarity from pre- to post-intervention (t(12) = −1.18, p = 0.13, one-tailed; mean difference = −0.07, one-sided 95% CI [−0.19, 0.04]). The four control regions, in comparison, showed either comparatively smaller or no change in FC similarity, and were all non-significant (VAN: t(12) = −0.71, p = 0.49, two-tailed; mean difference = −0.03, two-sided 95% CI [−0.11, 0.06]); DAN: t(12) = −0.33, p = 0.74, two-tailed; mean difference = −0.01, two-sided 95% CI [−0.08, 0.06]; DN: t(12) = 0.03, p = 0.96, two-tailed; mean difference = 0.00, two-sided 95% CI [−0.06, 0.06]; FPN: t(12) = 0.04, p = 0.97, two-tailed; mean difference = 0.00, two-sided 95% CI [−0.07, 0.07]). DN default network, VAN ventral attention network, DAN dorsal attention network, FPN frontoparietal network.

