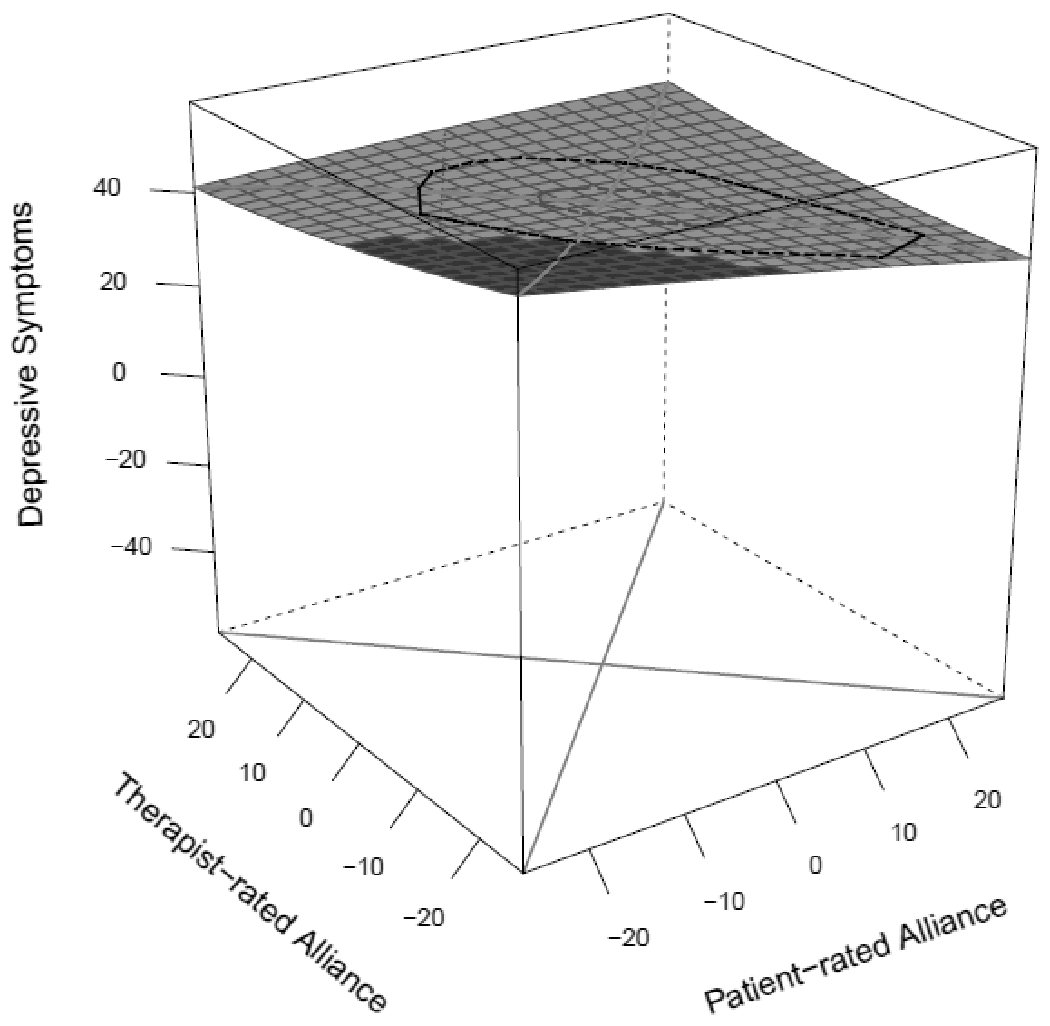
Figure 2. Average Response Surface for Patient and Therapist Alliance and Depressive Symptoms.

Note. Patient-rated alliance is on the horizontal axis, therapist-rated alliance is on the vertical axis, and depressive symptoms are on the depth axis. The line of congruence runs from the nearest corner to the farther corner and has a significant negative slope. This is represented by the slight downward tilt of the plane (the shaded region indicates values that are closer to the top of the graph). The line of congruence has a slight upward curvature, quantified by the positive value of parameter a2, which was not significantly different than zero. The line of incongruence runs from the left to the right of the figure. Its slope and curvature are quantified by parameters a3 and a4.
