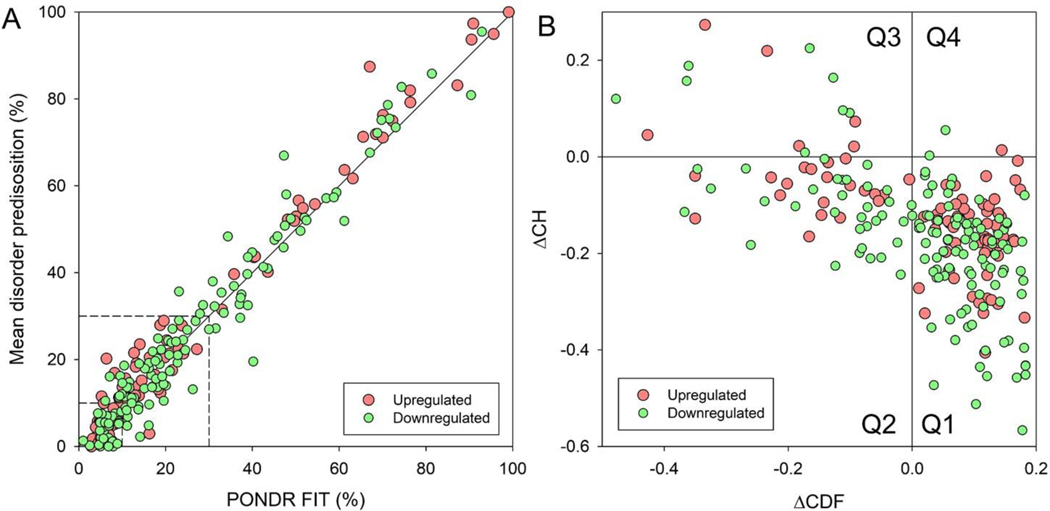
Figure 8: Global Intrinsic Disorder Analysis.
A) Plot correlating the mean disorder propensity (MDP) and PONDR® FIT score for selected proteins based on the results of PONDR® FIT analyses. Dashed lines represent boundaries separating ordered (MDP < 10%, PONDR® FIT < 10%) and disordered proteins (MDP ≥ 30%, PONDR® FIT ≥ 30%). B) CH-CDF plot analysis of selected proteins. Q1 (lower-right quadrant) – proteins predicted to be ordered by both predictors, Q2 (lower-left quadrant) – proteins predicted to be ordered by CH but disordered by CDF, Q3 (upper-left quadrant) – proteins predicted to be disordered by both predictors, and Q4 (upper-right quadrant) – proteins predicted to be disordered by CH and ordered by CDF.

