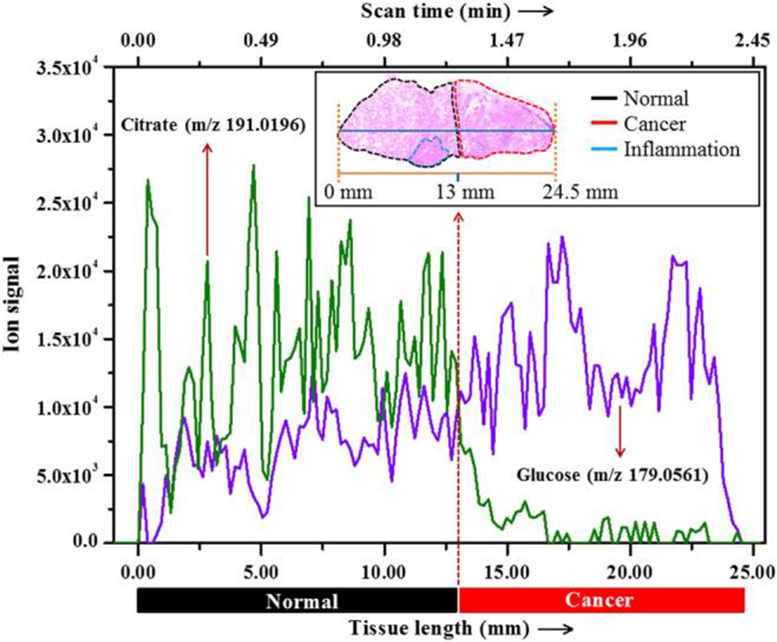
Figure 11:

Extracted ion chromatogram of glucose and citrate over a line scan of a typical prostate tissue specimen that contains both normal (inset, left side) and cancerous (inset, right side) areas. Inset shows staining of the tissue and position of the line scan (horizontal line) (reprinted with permission from Banerjee et al., 2017, copyright 2017 National Academy of Science).
