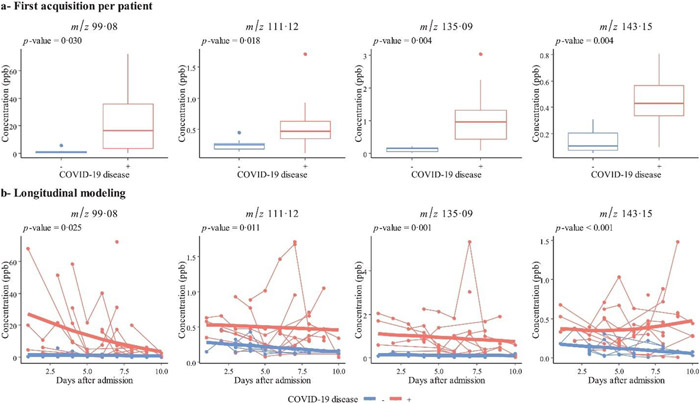
Figure 14:
Longitudinal analysis of VOCs in expired breath with the four features at m/z 99.08, 111.12, 135.09, and 143.15 which contributed the most to models and were assessed in (A) the first available sample for each patient and (B) over time during intubated, mechanically ventilated patients in ICU with COVID-19 ARDs (n=28, red) or non-COVID-19 ARDs (n=12, blue) (reprinted with permission from Grassin-Delyle et al., 2021 copyright 2021 Elsevier).

