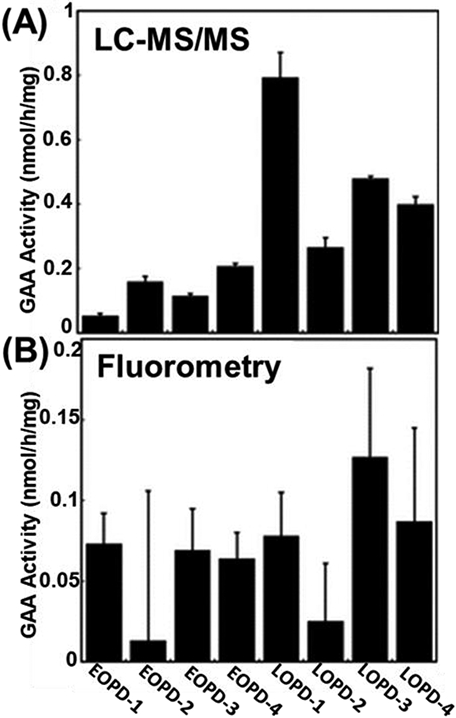
Figure 5:

Comparison of LC-MS/MS method applied by Lin et al (2017) with conventional fluorometry assay method for the NBS of Pompe disease with (A) LC-MS/MS analysis showing EOPD with lower activities than LOPD with statistical contrast as seen in the non-overlapping error bars, and (B) fluorometry assay analysis showing no correlation between GAA activity and severity of disease in EOPD and LOPD (reprinted with permission from Lin et al., 2017, copyright 2017 Oxford University Press).
