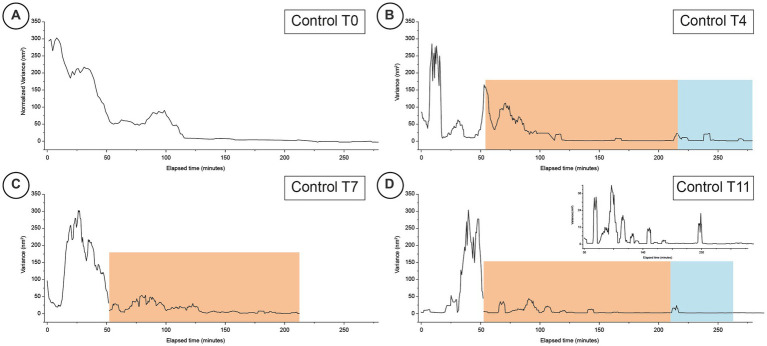
Figure 2.
Typical time-resolved variance of nanomotion experiments performed on healthy cells at different time-points (Panels A–D for days 0, 4, 7 and 11 respectively). The orange areas indicate the response to the exposure to the IPP buffer while the blue areas depict the time-periods when the cells were subsequently exposed for a second time to the buffer with no IPP. The inset graph for panel D is a higher magnification of the fine structure of the corresponding nanomotion variance graph to highlight the finer variations of the data.

