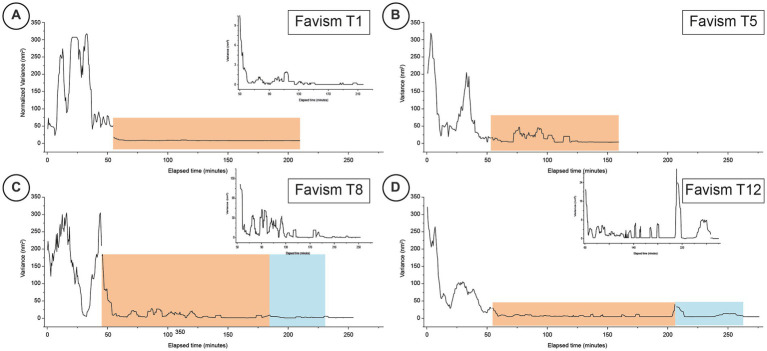
Figure 3.
Typical time-resolved variance of nanomotion experiments performed on favism cells at different time-points (Panels A–D for days 1, 5, 8 and 12 respectively). The orange areas indicate the response to the exposure to the IPP buffer while the blue areas depict the time-periods when the cells were subsequently exposed for a second time to the buffer with no IPP. The inset graphs for panels A,C,D are higher magnifications of the fine structure of the corresponding nanomotion variance graphs to highlight the finer variations of the data.

