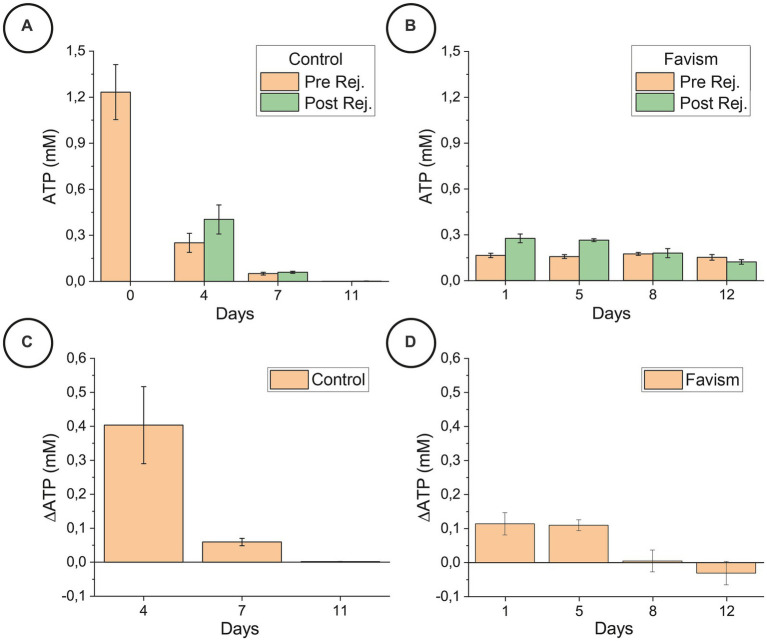
Figure 4.
ATP content before and after the rejuvenation process, for the control (panel A) and favism (panel B) cells, and corresponding ATP variation (panels C,D) collected on the very same day of the correspondent nanomotion sensor experiments on a different aliquot of samples. The reported error is the standard deviation. The statistical significance of the differences was confirmed by ANOVA tests (p < 0.05).

