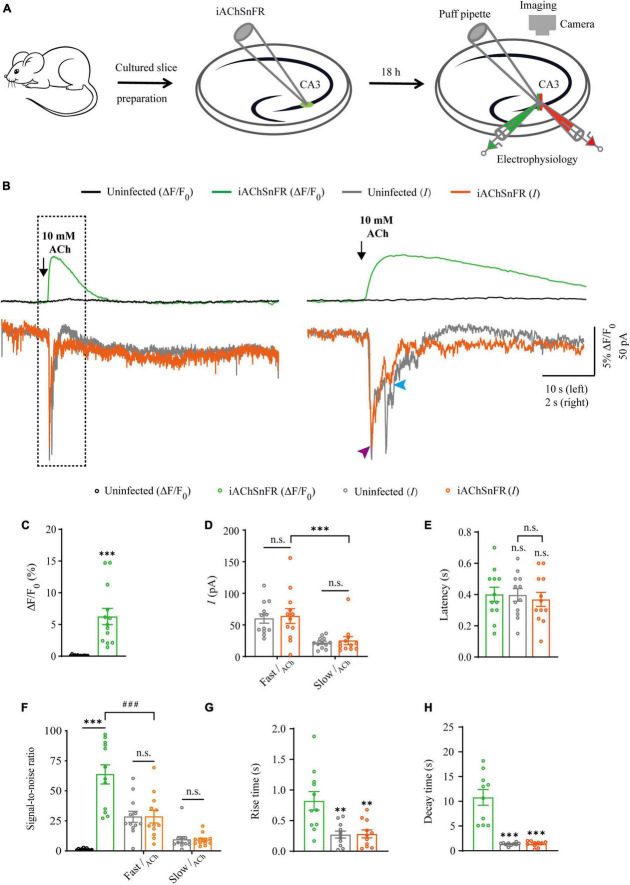
FIGURE 1.
Simultaneous measurement of acetylcholine using iAChSnFR fluorescent sensor and electrophysiological recording in CA3 neurons. (A) Schematic drawing of the design of simultaneous sensor imaging and whole-cell patch clamp recording experiments in cultured rat hippocampal slice preparation. (B) Left, simultaneous fluorescence (upper panel) and currents (lower panel) of iAChSnFR-expressing and control non-expressing CA3 neurons to a brief puff application of ACh. Right, the responses in the left rectangle box are shown again on an expanded time scale. (C) Values for fluorescence responses of iAChSnFR-expressing CA3 neurons compared to non-expressing CA3 neurons (iAChSnFR: 6.25 ± 1.28%; Ctrl: 0.11 ± 0.02%; p < 0.0010; n = 13). (D) Values for the amplitudes of fast cholinergic currents (iAChSnFR: 63.92 ± 11.71 pA; Ctrl: 60.06 ± 7.46 pA; p = 0.79; n = 12) and slow cholinergic currents (iAChSnFR: 25.08 ± 6.36 pA; Ctrl: 21.73 ± 2.51 pA; p = 0.67; n = 12; Fast current vs. Slow current: p = 0.0010) in iAChSnFR-expressing CA3 neurons compared to non-expressing CA3 neurons. (E) Values for the latencies of fast cholinergic currents in non-expressing (Ctrl: 0.40 ± 0.04 s; p = 1.00; n = 12) and iAChSnFR-expressing (iAChSnFR: 0.37 ± 0.04 s; p = 0.82; n = 12; Ctrl current vs. iAChSnFR current: p = 0.85) CA3 neurons compared to those of fluorescence responses of iAChSnFR-expressing CA3 neurons (iAChSnFR: 0.40 ± 0.05 s; n = 12). (F) Values for the signal-to-noise ratio (SNR) of cholinergic fluorescence responses of iAChSnFR-expressing CA3 neurons compared to non-expressing CA3 neurons (iAChSnFR: 63.67 ± 7.94; Ctrl: 1.34 ± 0.23; p < 0.0010; n = 12), and that of fast (iAChSnFR: 28.47 ± 5.29; Ctrl: 28.36 ± 4.58; p = 0.99; n = 12) and slow (iAChSnFR: 9.13 ± 1.41; Ctrl: 9.37 ± 2.54; p = 0.94; n = 12) cholinergic currents of iAChSnFR-expressing CA3 neurons compared to non-expressing CA3 neurons. Values for the signal-to-noise ratio (SNR) of fast cholinergic currents in iAChSnFR-expressing CA3 neurons (iAChSnFR: 28.47 ± 5.29; p < 0.0010; n = 12) compared to those of fluorescence responses of iAChSnFR-expressing CA3 neurons (iAChSnFR: 63.67 ± 7.94; n = 12). (G) Values for rise time of the cholinergic currents in non-expressing (Ctrl: 0.27 ± 0.06 s; p = 0.0052; n = 11) and iAChSnFR-expressing (iAChSnFR: 0.28 ± 0.07 s; p = 0.0036; n = 11) CA3 neurons compared to those of fluorescence responses of iAChSnFR-expressing CA3 neurons (iAChSnFR: 0.82 ± 0.15 s; n = 11). (H) Values for decay time of the cholinergic currents in non-expressing (Ctrl: 1.36 ± 0.10 s; p < 0.0010; n = 10) and iAChSnFR-expressing (iAChSnFR: 1.37 ± 0.19 s; p < 0.0010; n = 10) CA3 neurons compared to those of fluorescence responses of iAChSnFR-expressing CA3 neurons (iAChSnFR: 10.79 ± 1.59 s; n = 10). Data are shown as mean ± SEM. ***p < 0.001, **p < 0.01, two-tailed Student’s unpaired t-test in panels (C,D,G,H), ###p < 0.001, one-way ANOVA with Dunnett’s post-hoc test in panels (E,F).

