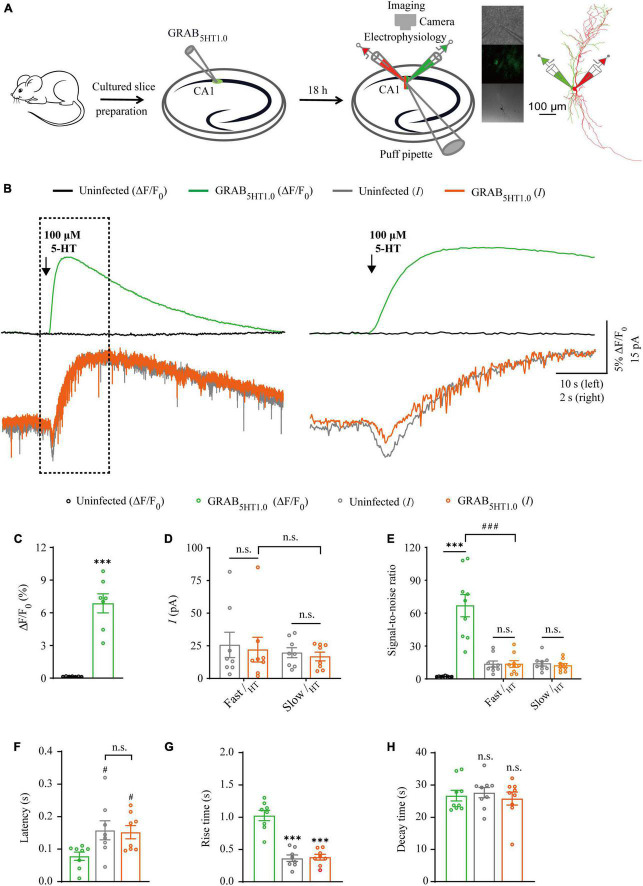
FIGURE 5.
Simultaneous measurement of serotonin using GRAB5HT1.0 fluorescent sensor and electrophysiological recording in CA1 neurons. (A) Schematic drawing outlining the design of simultaneous sensor imaging and electrophysiological recording experiments in cultured rat hippocampal slices. (B) Left, simultaneous fluorescence (upper panel) and electrophysiological (lower panel) responses of neighboring paired non-expressing and GRAB5HT1.0-expressing CA1 neurons to a brief puff application of 5-HT. Right, the responses in the left rectangle box are shown again in an expanded time scale. (C) Values for the fluorescence responses of GRAB5HT1.0-expressing CA1 neurons compared to non-expressing CA1 neurons (GRAB5HT1.0: 6.86 ± 0.88%; Ctrl: 0.15 ± 0.01%; p < 0.0010; n = 7). (D) Values for the amplitudes of fast (GRAB5HT1.0: 22.02 ± 9.45 pA; Ctrl: 25.66 ± 9.75 pA; p = 0.96; n = 8) and slow serotoninergic currents (GRAB5HT1.0: 16.80 ± 3.32 pA; Ctrl: 19.69 ± 3.83 pA; p = 0.57; n = 8; Fast current vs. Slow current: p > 0.99) in GRAB5HT1.0-expressing CA1 neurons compared to non-expressing CA1 neurons. (E) Values for the signal-to-noise ratio (SNR) of serotoninergic fluorescence responses of GRAB5HT1.0-expressing CA1 neurons compared to non-expressing CA1 neurons (GRAB5HT1.0: 66.85 ± 10.14; Ctrl: 2.16 ± 0.22; p < 0.0010; n = 9), and that of fast (GRAB5HT1.0: 13.58 ± 3.04; Ctrl: 13.60 ± 2.72; p = 1.00; n = 9) and slow (GRAB5HT1.0: 12.17 ± 1.81; Ctrl: 13.94 ± 2.23; p = 0.56; n = 9) serotoninergic currents of GRAB5HT1.0-expressing CA1 neurons compared to non-expressing CA1 neurons. Values for the SNR of fast serotoninergic currents in GRAB5HT1.0-expressing CA1 neurons (current: 13.58 ± 3.04; p < 0.0010; n = 9) compared to those of fluorescence responses of GRAB5HT1.0-expressing CA1 neurons (fluorescence: 66.85 ± 10.14; n = 9). (F) Values for latencies of fast serotoninergic currents in non-expressing (Ctrl: 0.16 ± 0.03 s; p = 0.032; n = 8) and GRAB5HT1.0-expressing (GRAB5HT1.0: 0.15 ± 0.02 s; p = 0.047; n = 8; Ctrl current vs. GRAB5HT1.0 current: p = 0.98) CA1 neurons compared to those of fluorescence responses of GRAB5HT1.0-expressing CA1 neurons (GRAB5HT1.0: 0.08 ± 0.01 s, n = 8). (G) Values for rise time of the serotoninergic currents in non-expressing (Ctrl: 0.36 ± 0.05 s; p < 0.0010; n = 8) and GRAB5HT1.0-expressing (GRAB5HT1.0: 0.38 ± 0.04 s; p < 0.0010; n = 8) CA1 neurons compared to those of fluorescence responses of iAChSnFR-expressing CA1 neurons (GRAB5HT1.0: 1.00 ± 0.08 s; n = 8). (H) Values for decay time of the serotoninergic currents in non-expressing (Ctrl: 27.65 ± 1.60 s; p = 0.57; n = 9) and GRABNE-expressing (GRAB5HT1.0: 25.82 ± 2.02 s; p = 0.91; n = 9) CA1 neurons compared to those of fluorescence responses of GRABNE-expressing CA1 neurons (GRAB5HT1.0: 26.73 ± 1.65 s; n = 9). Data are shown as mean ± SEM. ***p < 0.001, two-tailed Student’s unpaired t-test in panels (C,D,G,H), ###p < 0.001, #p < 0.05, one-way ANOVA with Dunnett’s post-hoc test in panels (E,F).

