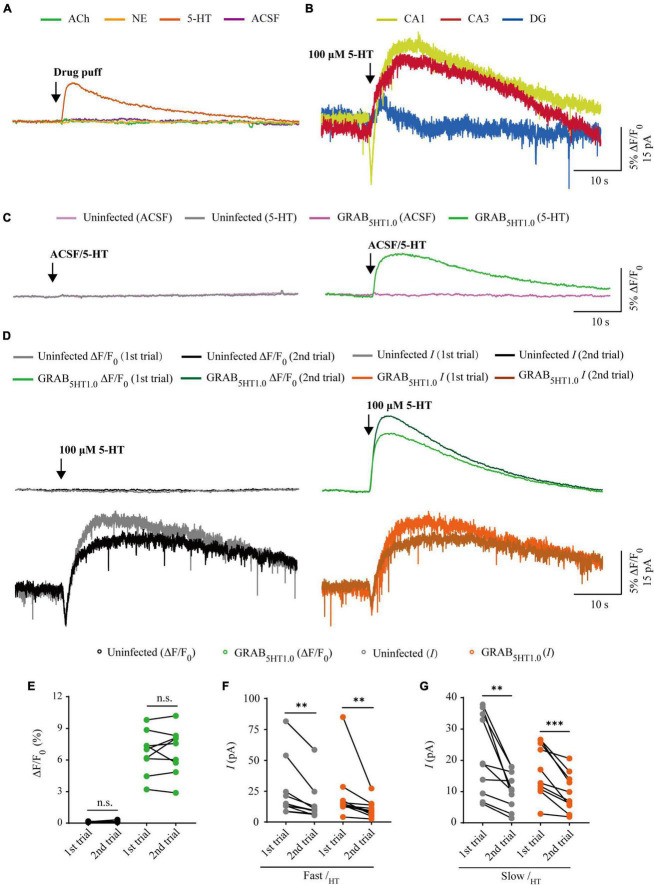
FIGURE 6.
Comparison of GRAB5HT1.0 fluorescence and electrophysiological responses to two consecutive serotonin application. (A) Fluorescence responses of GRAB5HT1.0-expressing cells to a brief drug puff (10 ms) application of 100 μM 5-HT, 10 mM ACh, 200 μM NE, and ACSF, respectively. (B) Electrophysiological responses of CA1, CA3, and DG neurons to a brief (10 ms) puff application of 100 μM 5-HT. (C) Fluorescence responses of control non-expressing (left) and GRAB5HT1.0-expressing (right) CA1 neurons to a brief puff (10 ms) application of ACSF and 100 μM 5-HT. (D) Fluorescence (upper panel) and electrophysiological (lower panel) responses of non-expressing (left) and GRAB5HT1.0-expressing (right) CA1 neurons to two consecutive brief puff of 5-HT. (E) Values for the two consecutive fluorescence responses of control non-expressing CA1 neurons (first: 0.13 ± 0.01%; second: 0.14 ± 0.03%; p = 0.51; n = 9) and GRAB5HT1.0-expressing CA1 neurons (first: 6.70 ± 0.68%; second: 6.87 ± 0.73%; p = 0.65; n = 9). (F) Values for the two consecutive fast inward serotoninergic currents in control non-expressing (first: 25.47 ± 7.52 pA; second: 15.30 ± 5.12 pA; p = 0.0020; n = 10) and GRAB5HT1.0-expressing (first: 21.88 ± 7.23 pA; second: 10.63 ± 2.22 pA; p = 0.0020; n = 10) CA1 neurons. (G) Values for the two consecutive slow outward serotoninergic currents of control non-expressing (first: 21.63 ± 4.07 pA; second: 10.61 ± 1.88 pA; p = 0.0062; n = 10) and GRAB5HT1.0-expressing (first: 16.76 ± 2.64 pA; second: 9.73 ± 1.95 pA; p < 0.0010; n = 10) CA1 neurons. Data are shown as mean ± SEM. ***p < 0.001, **p < 0.01, two-tailed Student’s paired t-test.

