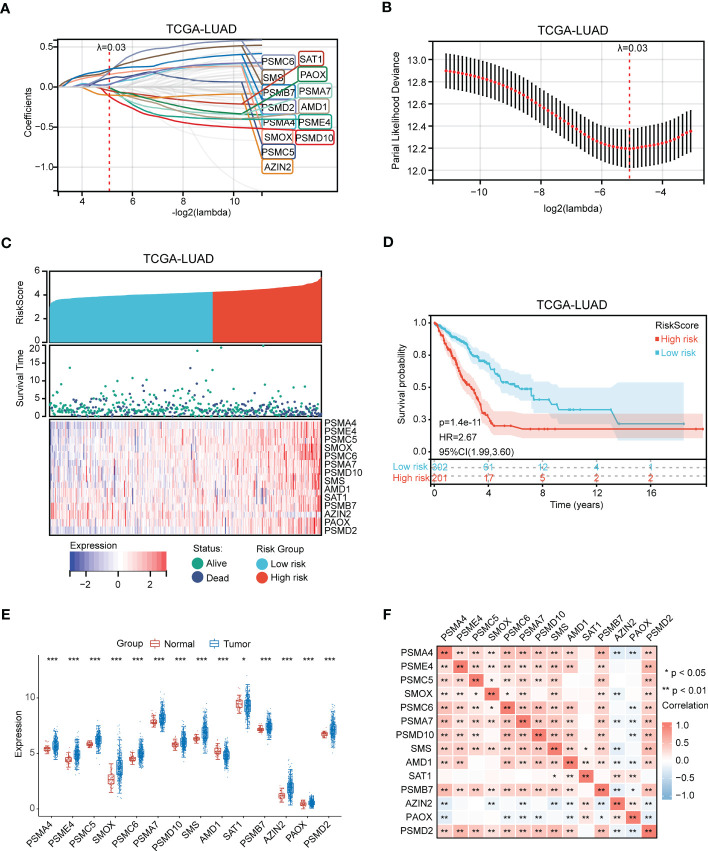
Figure 3.
Identification of polyamines metabolism-associated gene signatures for risk score model. (A) Screening of the polyamines metabolism-associated gene signatures for risk score model using the LASSO algorithm. (B) The best log (Lambda) value in the model. (C) Heatmap depicting genes expression distribution and survival status in LUAD patients. (D) Kaplan-Meier plot depicting overall survival of high- and low- risk LUAD patients. (E) Box plot depicting the expression of gene signatures in risk score model. (F) Heatmap depicting the correlation among these gene signatures. Statistical analysis: *P < 0.05, **P < 0.01, and ***P < 0.001.

