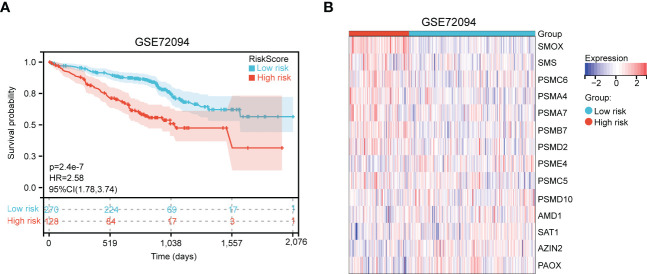
Figure 4.
Validation of polyamines metabolism-associated risk score model in GSE72094 cohort. (A) Kaplan-Meier plot depicting overall survival of high- and low- risk LUAD patients in the independent cohort. (B) Heatmap depicting the expression of these gene signatures in risk score model in the independent cohort.

