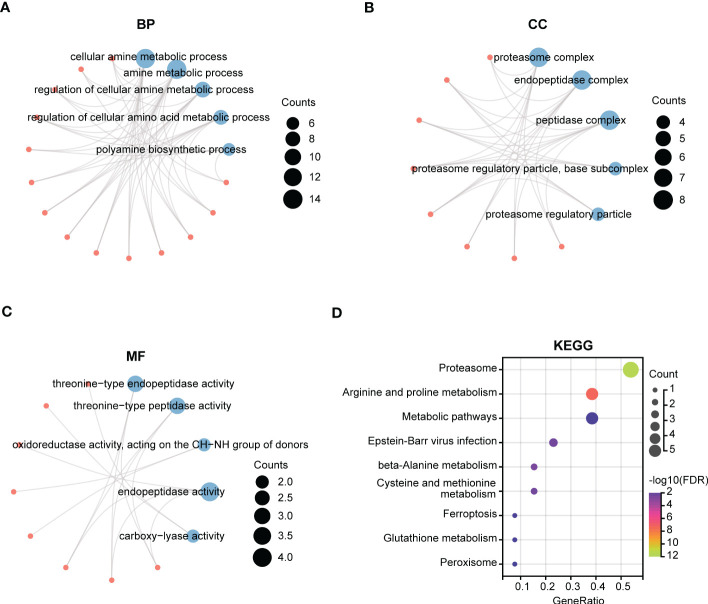
Figure 5.
Function enrichment analysis of polyamines metabolism-associated gene signatures. (A-C) The top5 pathways of (A) BP (biological process), (B) CC (cellular component), and (C) MF (molecular function) in GO enrichment analysis of polyamines metabolism-associated gene signatures. (D) KEGG enrichment analysis of these gene signatures. The size of the circle means the number of enriched genes, and the larger the number, the larger the circle.

