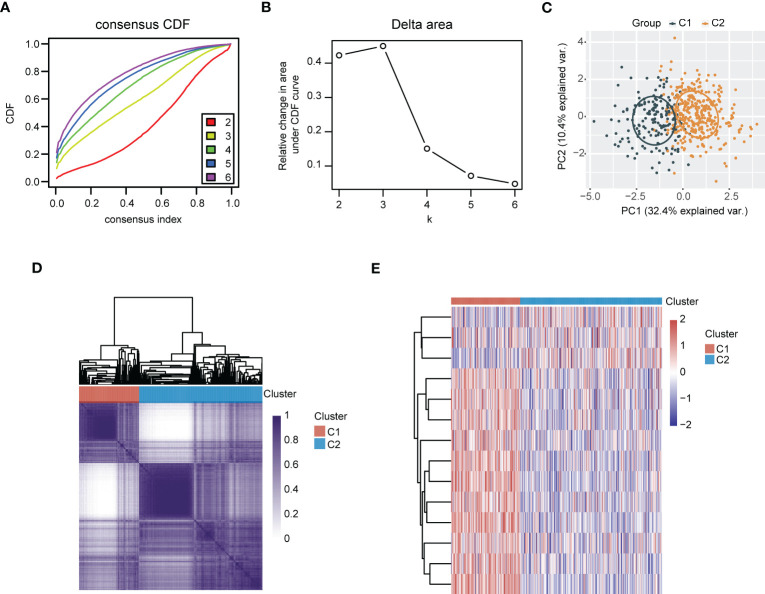
Figure 8.
Recognition of polyamines metabolism-associated subgroups in LUAD patients through consensus clustering analysis. (A) Consensus clustering of the cumulative distribution function (CDF) curve. (B) The relative change in area under CDF curve. (C) Principal component analysis (PCA) of C1 and C2 subgroups. (D) Heatmap of consensus clustering (k = 2). (E) Heatmap depicting the expression of gene signatures in C1 and C2 subgroups of LUAD patients.

