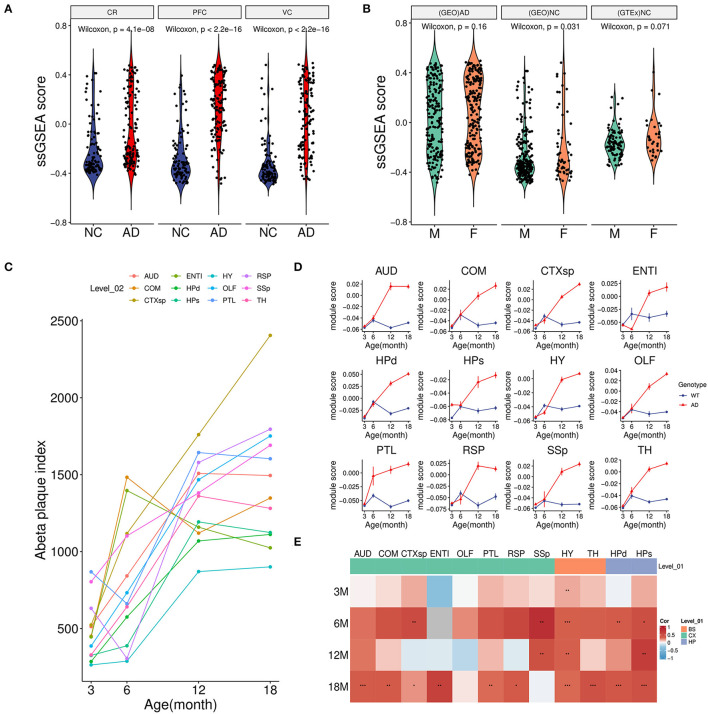
Figure 3.
Association between module activity and Aβ. (A) Boxplot of the green module ssGSEA score difference between AD and NC among three brain regions. CR, cerebellum (GSE44768); PFC, dorsolateral prefrontal cortex (GSE44770); VC, visual cortex (GSE44771). (B) Boxplot of the green module ssGSEA score difference between male (M) and female (F) in different groups. (GEO)AD, all AD patients of above microarray data from GEO; (GEO)NC, all healthy controls of above microarray data from GEO; (GTEx)NC, normal brain samples from the GTEx project. (C) Line plot showed an average Aβ plaque index of different age stages in AD model mice among 12 brain regions. For detailed region information, refer the link (https://alzmap.org). (D) Line plots of the green module score difference at different age stages between the AD model and control mice among 12 brain regions. (E) Correlation heatmap of the Aβ plaque loading index and green module score between different age stages and brain regions in AD model mice. *p < 0.05, **p < 0.01, ***p < 0.001.

