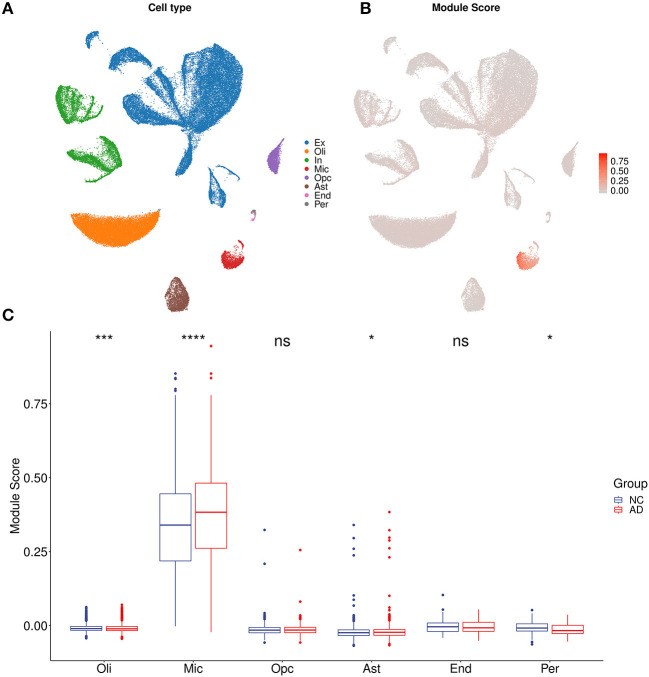
Figure 6.
AIM-related cell type analysis. (A) UMAP plot of eight primary cell types in syn18485175 snRNA-seq. Ex, excitatory neurons; In, inhibitory neurons; Mic, microglia; Oli, oligodendrocytes; Opc, oligodendrocyte progenitors; Ast, astrocytes; End, endothelial; Per, pericytes. (B) UMAP plot of snRNA-seq. Each cell was colored according to AIM expression. (C) Bar plot showing AIM expression in different cell types. Blue denotes the control group and red denotes the AD group. The Wilcoxon test method was used to compare the group difference. ns: p > 0.05, *p ≤ 0.05, ***p ≤ 0.001, ****p ≤ 0.0001.

