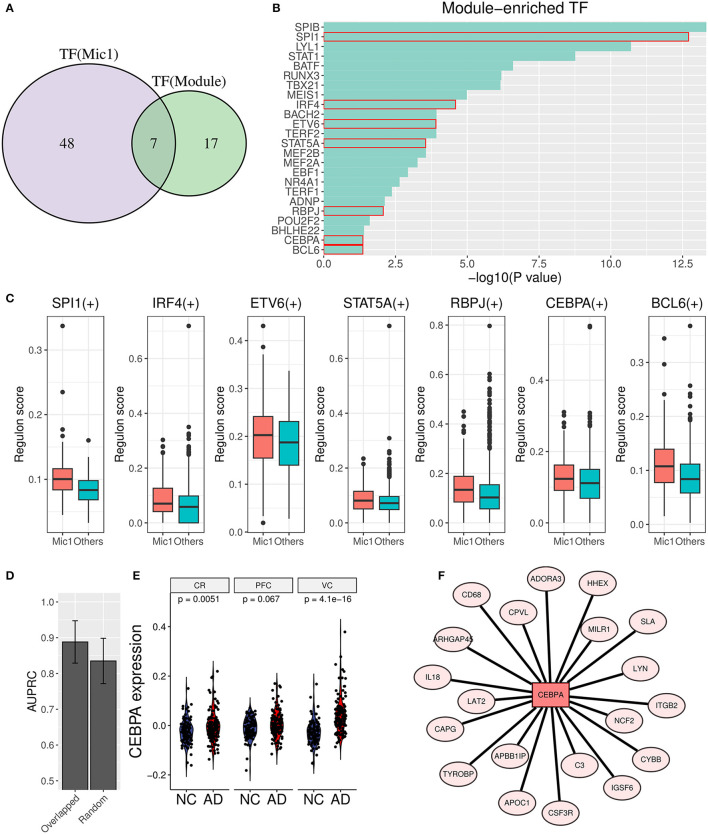
Figure 8.
Transcription factor analysis for AIM. (A) Venn diagram displays the overlap between AIM-enriched TFs and Mic1-related TFs. (B) Bar plot of AIM-enriched TFs. The seven shared TFs were marked by a red box. (C) Boxplot of seven overlapped TFs involved regulon activity between the Mic1 subtype and other subtypes. (D) Bar plot of AUPRC distribution of above TFs or random seven human TFs based on GSE44770 microarray data. The model was based on a logistic algorithm. Selected TF expression was used as a feature, and sample grouping (AD or non-AD) was used as diagnostic targets. (E) Violin plot of CEBPA expression difference between NC and AD is based on three microarray datasets (GSE44768, GSE44770, and GSE44771). (F) TF network diagram shows CEBPA and its target genes in the AIM.

