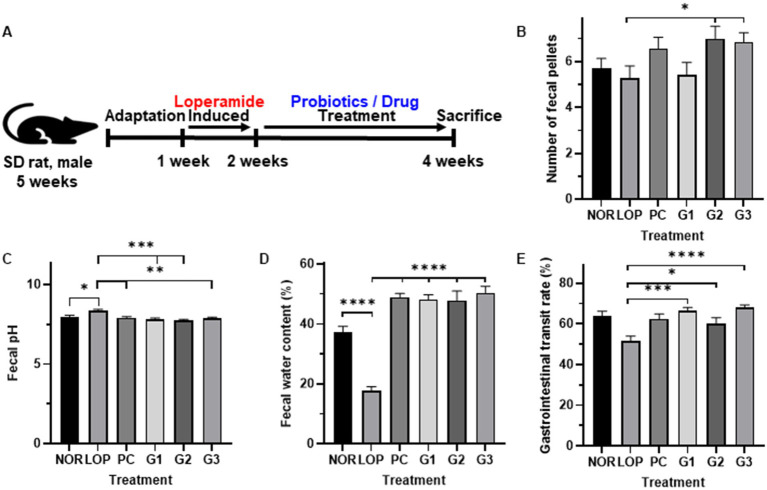
Figure 1.
Changes in indicators related to constipation by multi-strain probiotics Consti-Biome. (A) Showed experimental scheme. (B); number of fecal pellets, (C); Fecal pH, (D); Fecal water content, (E); gastrointestinal transit rate of normal control (NOR), loperamide administration (LOP), positive control (PC), low concentration multi-strain probiotics administration (G1, 2 × 10⁸ cfu/mL), medium concentration multi-strain probiotics administration (G2, 2 × 10⁹ cfu/mL), and high concentration probiotic administration (G3, 2 × 10¹⁰ cfu/mL) groups. Data were collected 2 weeks after treatment. Data are mean ± SEM of 7 animals. *p < 0.05, **p < 0.01, *** p < 0.001, **** p < 0.0001, significantly different from the LOP as per one-way ANOVA with the Tukey’s multiple comparisons test.

