Figure 3.
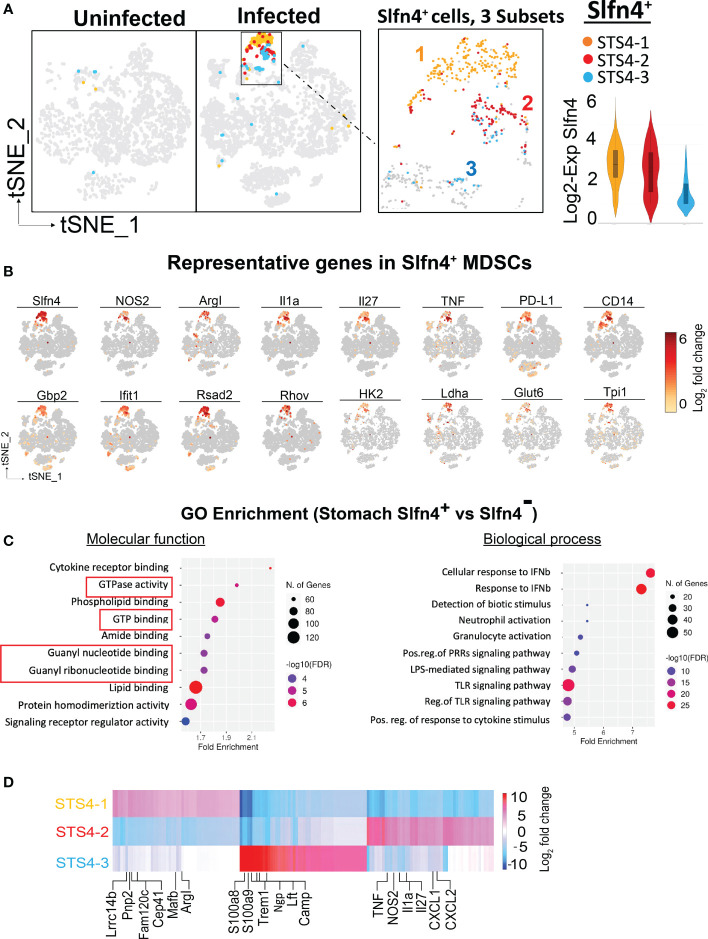
Single cell transcriptional profiling of Slfn4+ immune cells from mouse stomachs. (A) Stomach single cell Slfn4 gene expression was color coded for 3 subsets STS4-1(Maize), STS4-2(red) and STS4-3 (blue). The boxed area with Slfn4 gene expression was enlarged on the right. Violin plots depict Slfn4 expression levels (log2 transformation) in each subset. (B) Representative up-regulated genes color-coded fold-change expression levels (gray to red of 12 representative genes in Slfn4+ -MDSCs). (C) GO enrichment analysis of upregulated genes in stomach Slfn4 + vs Slfn4 - immune cells. The top 10 significantly enriched GO (−log10 (p-value)) terms of molecular functions and biological process were shown. Upregulated genes in Slfn4+ were identified by 10x Loupe browser with (log2 FC>0.58, FDR ≤ 0.05) relative to Slfn4- cells. (D) Heatmap of DEGs between 3 subsets of STS4. Representative enriched genes in each subset were indicated. The color scale is from log2 FC-10 (blue) to log2 FC 10 (red). DEGs were identified by 10X Loupe browser (FDR ≤ 0.05) relative to all the other subsets.

