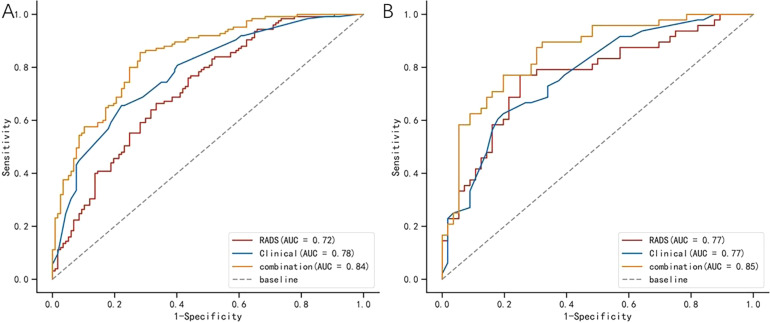
Figure 3.
Comparison of ROC curves among the clinical model, radiomics model, and combined model respectively in the training cohorts (A) and testing cohorts (B). The AUC values in the combined model are better than in the clinical model and radiomics model for the prediction of IMA.
Abbreviations: ROC, receiver operating characteristic; AUC, area under the curve; IMA, invasive mucinous adenocarcinoma.

