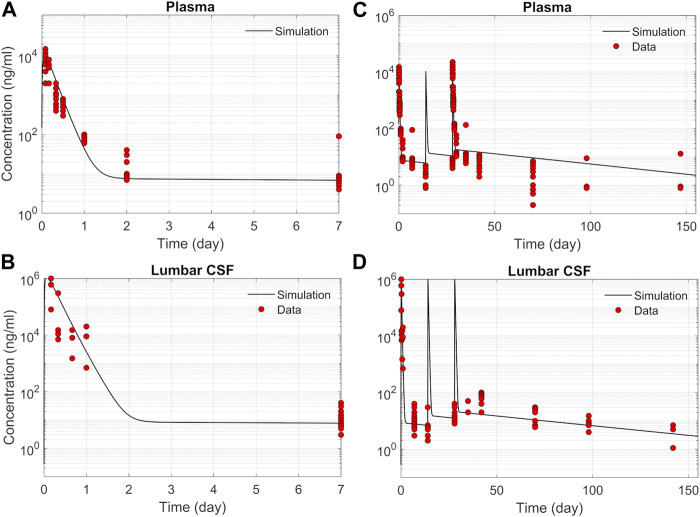
FIGURE 2.
Comparison of the model fit with individual ASO PK data (Monine et al., 2021). (A) Plasma concentration-time profile over 7 days following IT administration of a single 12 mg dose. (B) CSF concentration-time profile in the lumber region over 7-day following IT administration of a single 12 mg dose. (C) Plasma concentration-time profile following IT administration of three repeated 12 mg doses applied at 2-week intervals. (D) CSF concentration-time profile in the lumbar region following IT administration of three repeated 12 mg doses applied at 2-week intervals.

