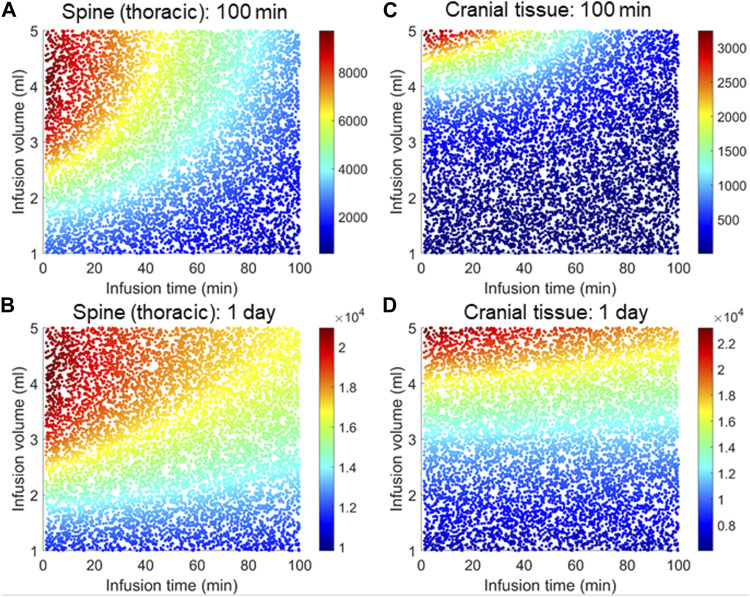
FIGURE 8.
Combined effects of infusion volume and time on tissue distribution. Each panel corresponds 8,000 simulations each for a distinct combination of infusion time and infusion volume randomly sampled from the range specified by the X-and Y-axis, respectively. The color map indicates relative concentrations. (A) and (B) represent the thoracic region spinal tissue, (C) and (D) represent the cranial tissue at the indicated times. In all simulations, time zero is marked by the start of the infusion. A fixed amount (12 mg) ASO was considered regardless of the infusion volume or infusion time.

