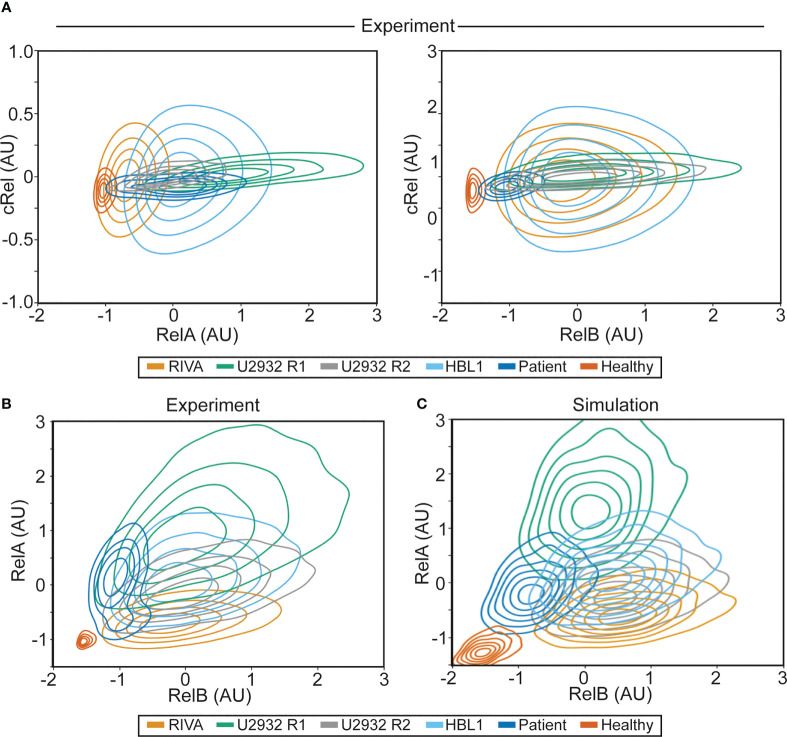
Figure 4.
NF-κB fingerprinting can be applied to cell lines, DLBCL patient samples and healthy blood and reveals a unique NF-κB state in each cell population. (A) Experimentally measured NF-κB fingerprinting based on RelA and cRel abundance (left), and cRel and RelB abundance (right). Cell density is indicated with a contour plot and each cell population is shown in distinct colors. (B) Experimentally measured NF-κB fingerprinting based on RelA and RelB abundance. Cell density is indicated with a contour plot and each cell population is shown in distinct colors. (C) Computationally simulated NF-κB fingerprints in six cell population specific computational simulations informed by experimental NF-κB fingerprinting (B). 1,000 cells were simulated in each cell population (6,000 simulations in total), with cell-to-cell variability incorporated as described previously (32), cell density is indicated with a contour plot and each cell population is shown in distinct colors.

