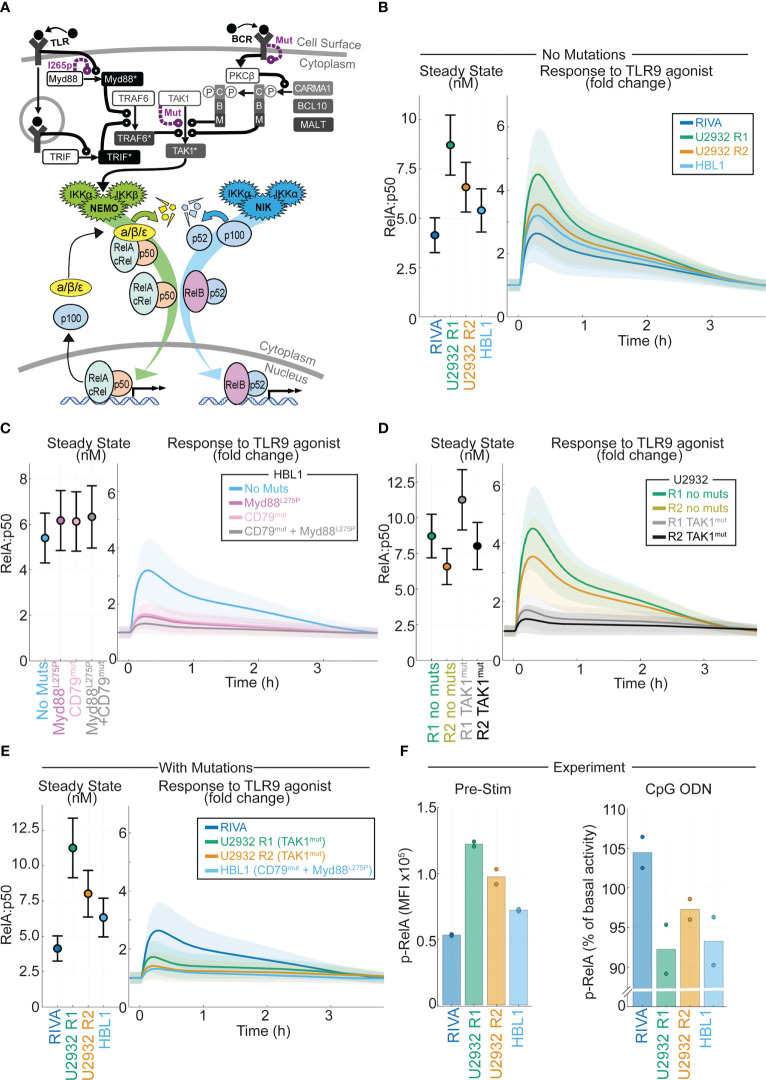
Figure 5.
Computational modeling of DLBCL, including receptor-proximal signaling, enables integration of NF-kB fingerprints and mutational data to predict response to the tumor microenvironment. (A) Schematic of the computational model constructed by combining existing models of TLR signaling (55), BCR signaling (37), and NF-kB/IkB regulation (54). All models are run as published with active IKK species summed from the BCR and TLR models to determine the active IKK input curve to the NF-kB model. Schematic combines some repeated species, a more detailed schematic is included in Figure S3. (B) Cell line specific simulations of nuclear RelA:p50 in each virtual cell line at steady state (left) and the fold change in nuclear RelA:p50 in response to stimuli (right). Mean and standard deviation of 25 single cell simulations is indicated. (C) Simulated abundance of nuclear RelA:p50 in virtual HBL1 cell line with no changes (blue), with auto-activating Myd88 to recapitulate MYD88l265p (purple), and with high basal BCR signaling to recapitulate CD79B mutations present in this cell line (pink), and the combination of the two mutations (grey). Mean and standard deviation of 25 single cell simulations is indicated. (D) Simulated nuclear RelA:p50 in virtual U2932 cell line with no changes (R1 green, R2 yellow), with increased TAK1 activity recapitulate the TAK1 mutation present in this cell line (R1 grey, R2 black). Mean and standard deviation of 25 single cell simulations is indicated. (E) Cell line specific simulations of nuclear RelA:p50 in each virtual cell line at steady state (left) and the fold change in nuclear RelA:p50 in response to stimuli (right), with mutational event included from panels (C, D). Mean and standard deviation of 25 single cell simulations is indicated. (F) Experimentally measured median fluorescence intensity (MFI) of phosphorylated RelA in each indicated cell line. The mean of two replicates is shown with individual experiments indicated with a dot. The unstimulated MFI is shown (left) with the percentage change in MFI following 45 mins of activation of TLR9 with CpG ODN shown (right).

