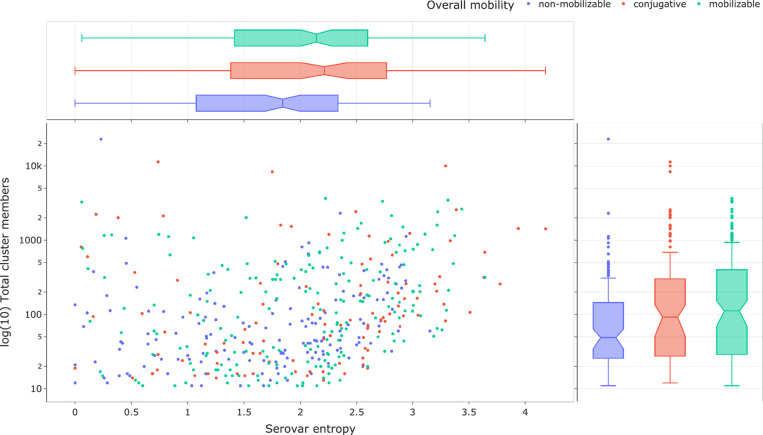
Fig. 2.
Scatter plot of individual MOB-clusters coloured based on their overall mobility class prediction. The y-axis is the log-scale number of occurrences of a MOB-cluster in the dataset and the x-axis is the serovar entropy (nats) based on sistr predictions. Box plots are presented for the marginal distributions for each axis.

