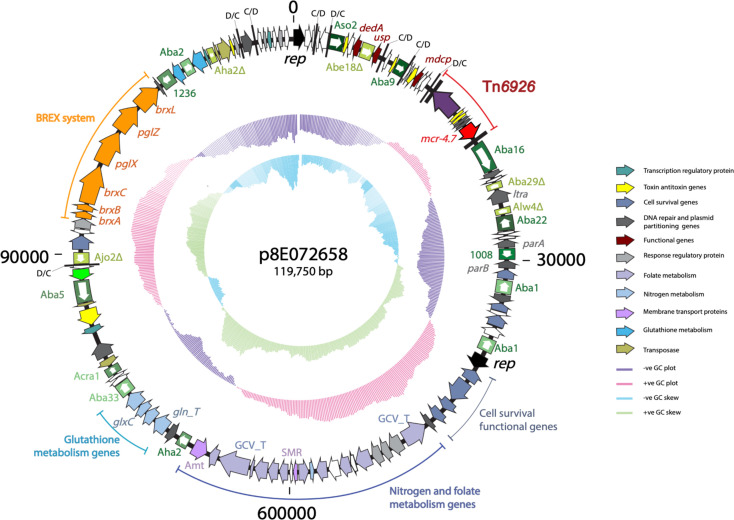
Fig. 1.
Circular representation of p8E072658, showing the distribution of functional genes. The outer black ring represents the backbone of the plasmid. Arrows indicate the extent and orientation of genes and are colour coded as per their associated functions with the keys shown on the right. The boxed arrows are insertion sequences (IS) and are labelled along the IS elements. The two inner rings represent the GC plot and GC skew, respectively. Small vertical black bars labelled C/D or D/C represent the pdif recombination sites (XerC/D or XerD/C).

