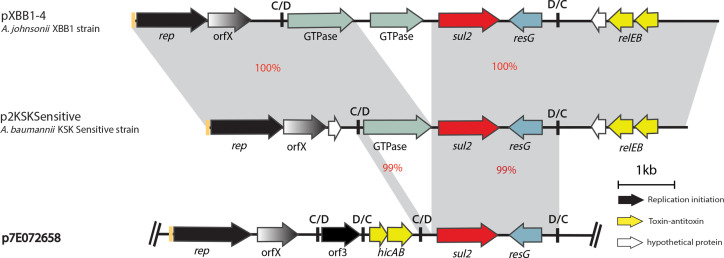
Fig. 3.
Schematic of the linearized partial map of p7E072658 containing the sul2 gene within a pdif module compared to similar pdif modules found in unrelated plasmids. The horizontal central black lines represent the plasmid backbone. The arrows indicate gene orientation, and the boxed arrows represent IS. The grey shadings demonstrate significant percentage identities, coloured red. The genes/ORFs are labelled below according to their associated functions and the key is shown on the right. Iterons are shown in orange bars preceding the rep genes. Small vertical black bars labelled C/D or D/C represent the two pdif recombination sites (XerC/D or XerD/C). The scale bar is shown below and drawn to scale from GenBank accession numbers CP061707 (p7E072658), CP061707.1 (p2KSKSensitive) and CP061707.1 (pXBB1-4).

