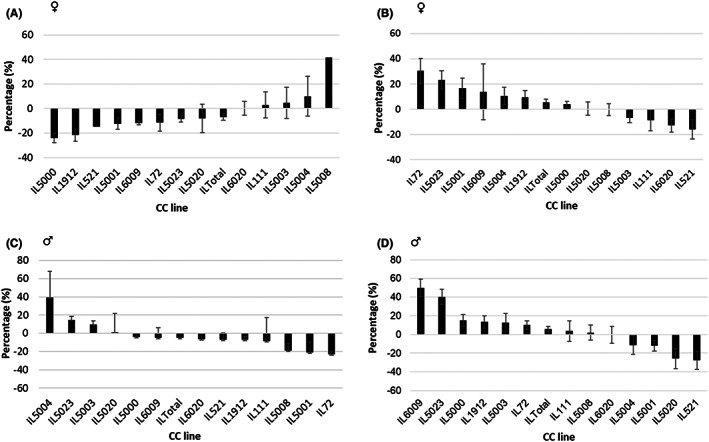
FIGURE 2.

Percentage changes (Delta) in fasting blood glucose (FBG) between weeks 12 and 0 of the female and male mice of 13 different collaborative cross (CC) lines maintained on either a standard chow diet (CHD) or a high‐fat diet (HFD) for 12 weeks. Panels A and B show the profiles of the female mice of 13 different CC lines maintained on CHD and HFD, respectively, for 12 weeks. Panels C and D show the profiles of the male mice of 13 CC lines maintained on CHD and HFD, respectively, for 12 weeks. In all the panels A–D, the x‐axis shows the thirteen CC lines, while the y‐axis represents the percentage (%) FBG differences between weeks 12 and 0 during the experiment.
