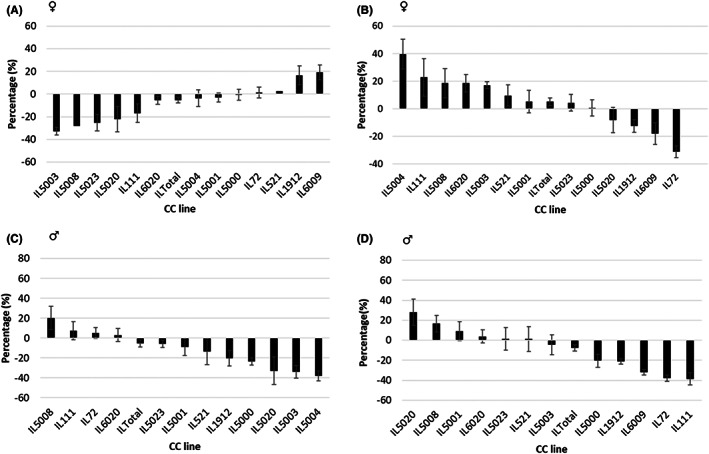
FIGURE 3.

Percentage changes (Delta) in fasting blood glucose (FBG) between weeks 12 and 18 of the female and male mice of 13 different collaborative cross (CC) mice maintained on a standard chow diet (CHD) or a high‐fat diet (HFD) for weeks 12 and subsequently treated with NDM for six weeks. Panels A and B show the profiles of the female mice of 13 different CC lines maintained a CHD and HFD, respectively, during the 6 weeks of NDM treatment. Panels C and D show the profiles of the male mice of 13 CC lines maintained on a CHD and HFD, respectively, during the 6 weeks of NDM treatment. In all the panels A–D, the x‐axis shows the thirteen CC lines, while the y‐axis represents the percentage (%) FBG differences between weeks 12 and 18 during the experiment.
