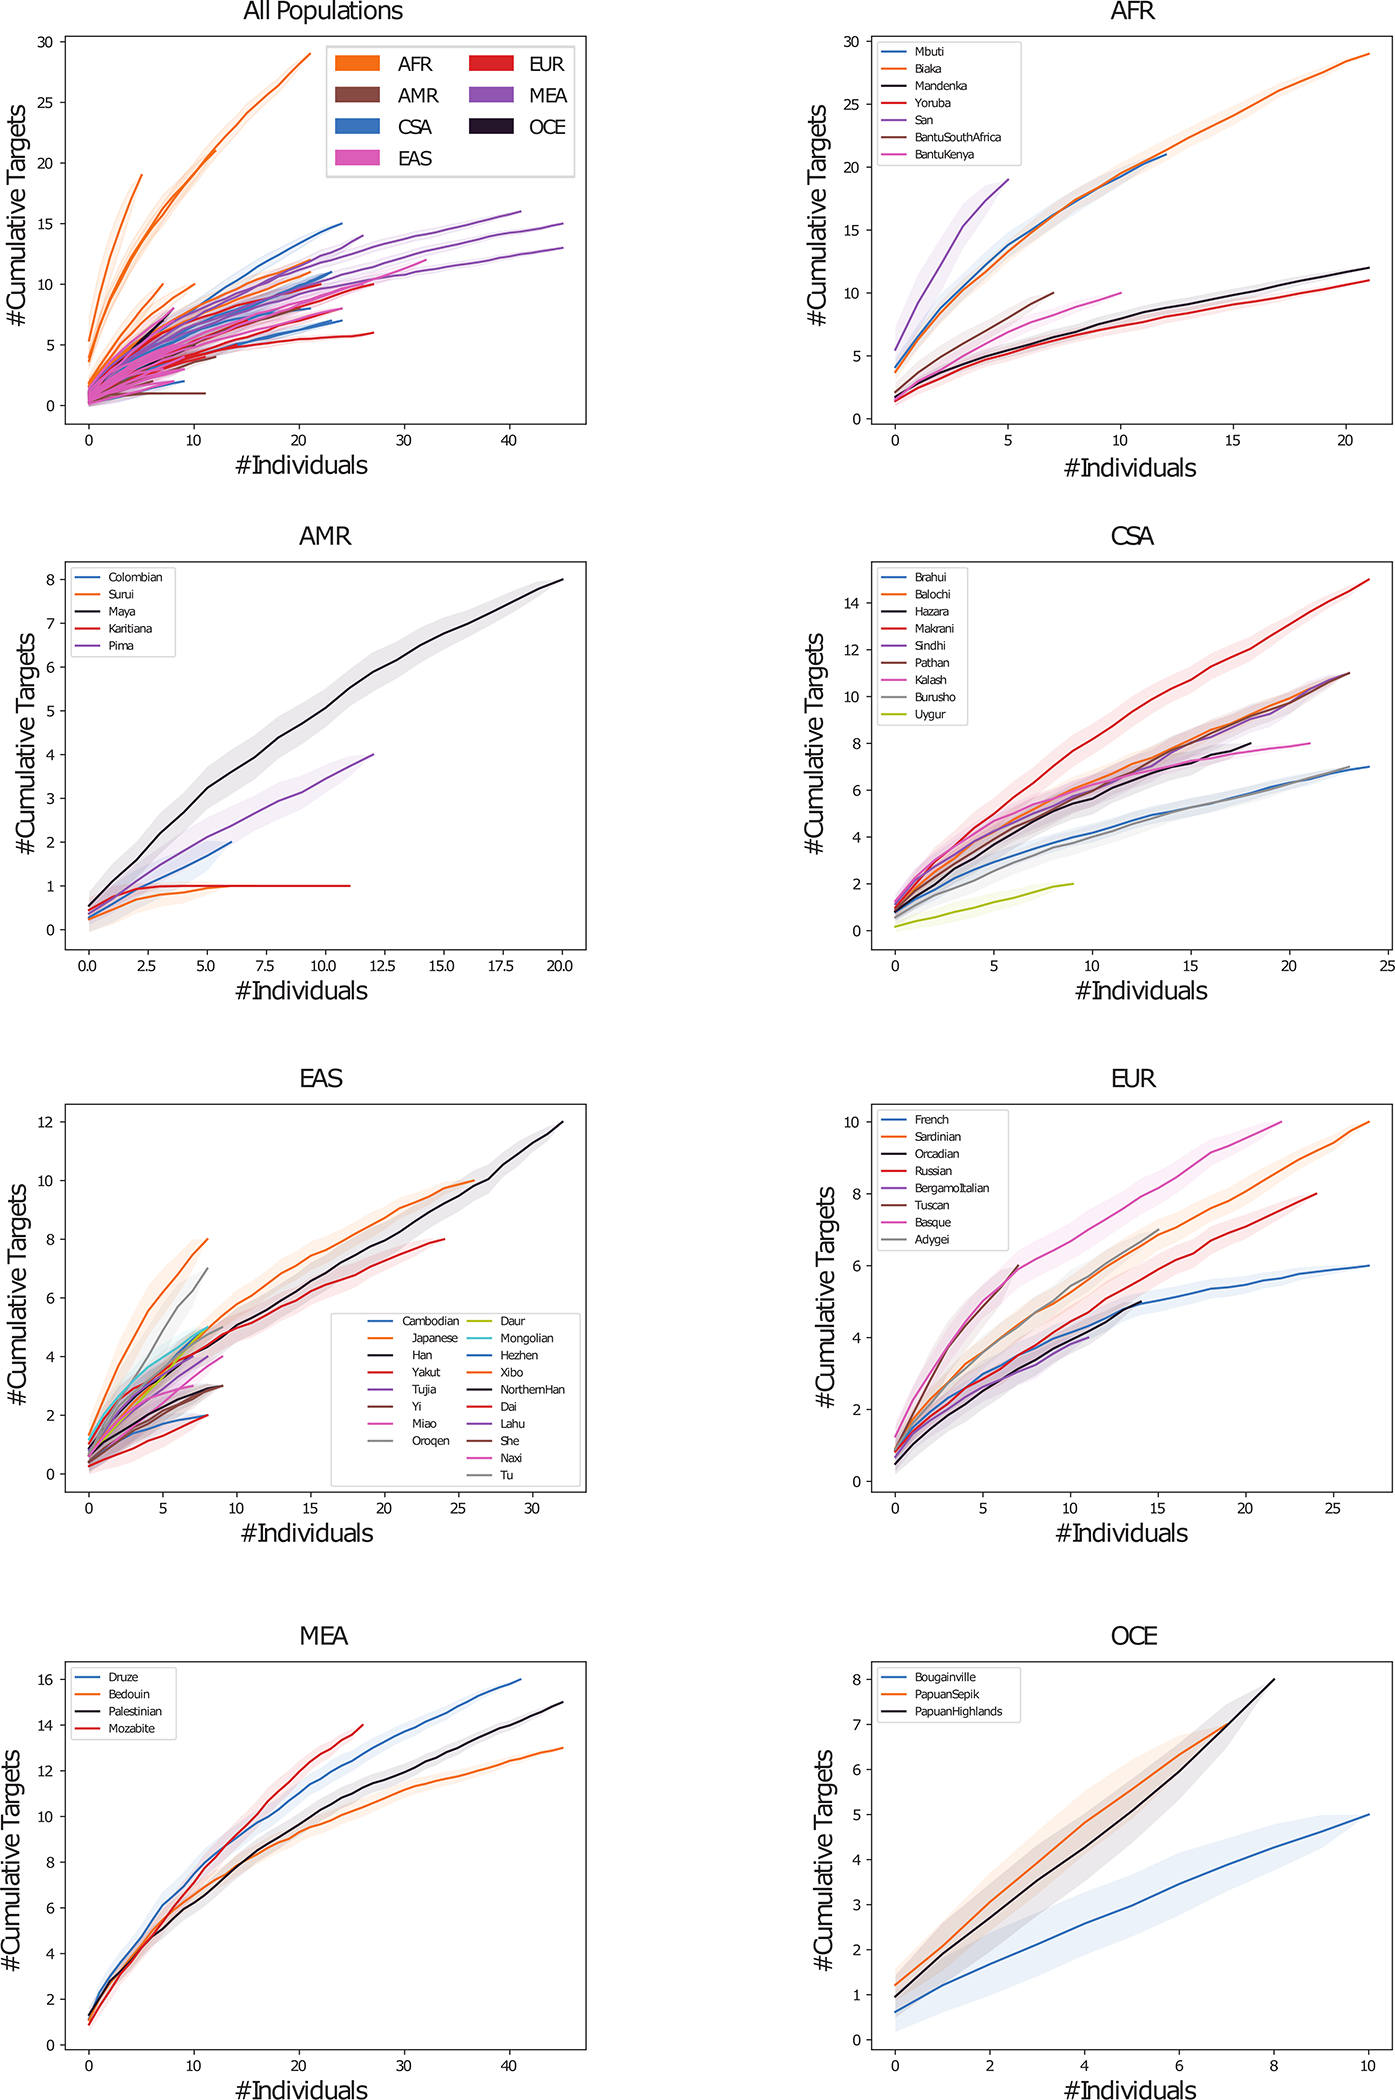
Extended Data Figure 3. HGDP super-population distribution plots.

Cumulative distribution plot of HGDP variant off-targets with CFD≥0.2 and increase in CFD of ≥0.1 per super-population. Individual samples from each of the seven super-populations were shuffled 100 times to calculate the mean and 95% confidence interval (shading around lines). First panel shows distribution within all 54 discrete populations, colored by super-population. Additional seven panels show distribution of discrete populations within each listed super-population.
