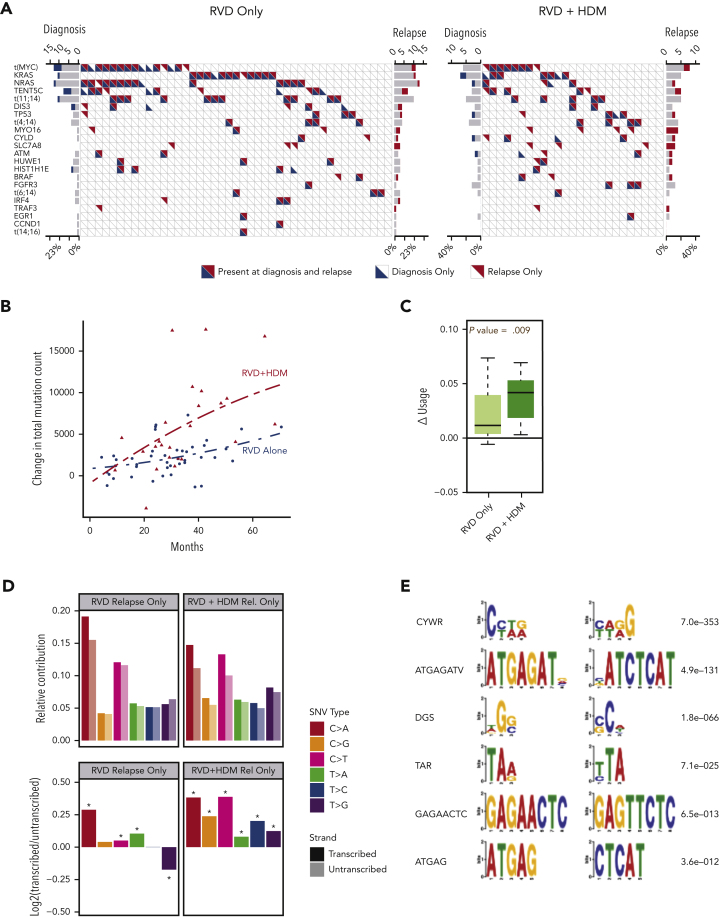
Figure 2.
Driver events and mutational locations. (A) Frequency of driver mutations and translocations (y-axis) are shown for RVD-alone (left) and RVD + HDM (right) arms. Each column shows 1 patient; blue and red triangles show mutations detected at diagnosis and relapse, respectively. (B) Change in total mutational load from diagnosis to relapse (y-axis). Red triangles (patients treated with RVD + HDM) and blue points (patients treated with RVD alone) show the total mutational load difference between diagnosis and relapse for each patient. Polynomial regression curves are shown for the 2 arms over time (x-axis). (C) Change in genomic region use (y-axis) for mutations overlapping with RNAs for RVD-alone and RVD + HDM arms (left to right). (D) Transcription strand bias analysis. Relative contribution (y-axis, top) for 6 possible SNV types (color coded) for relapse-only mutations are shown. Contributions from mutations overlapping with transcribed strand are shown in darker colors, and transcribed strand shown in lighter colors. log2 ratio of transcribed/untranscribed strands are shown (bottom) with statistically significant differences marked with an asterisk (∗). (E) De novo motifs identified 12 bp upstream and downstream of SNVs. Consensus motifs (left) and significance values (right) are shown.

