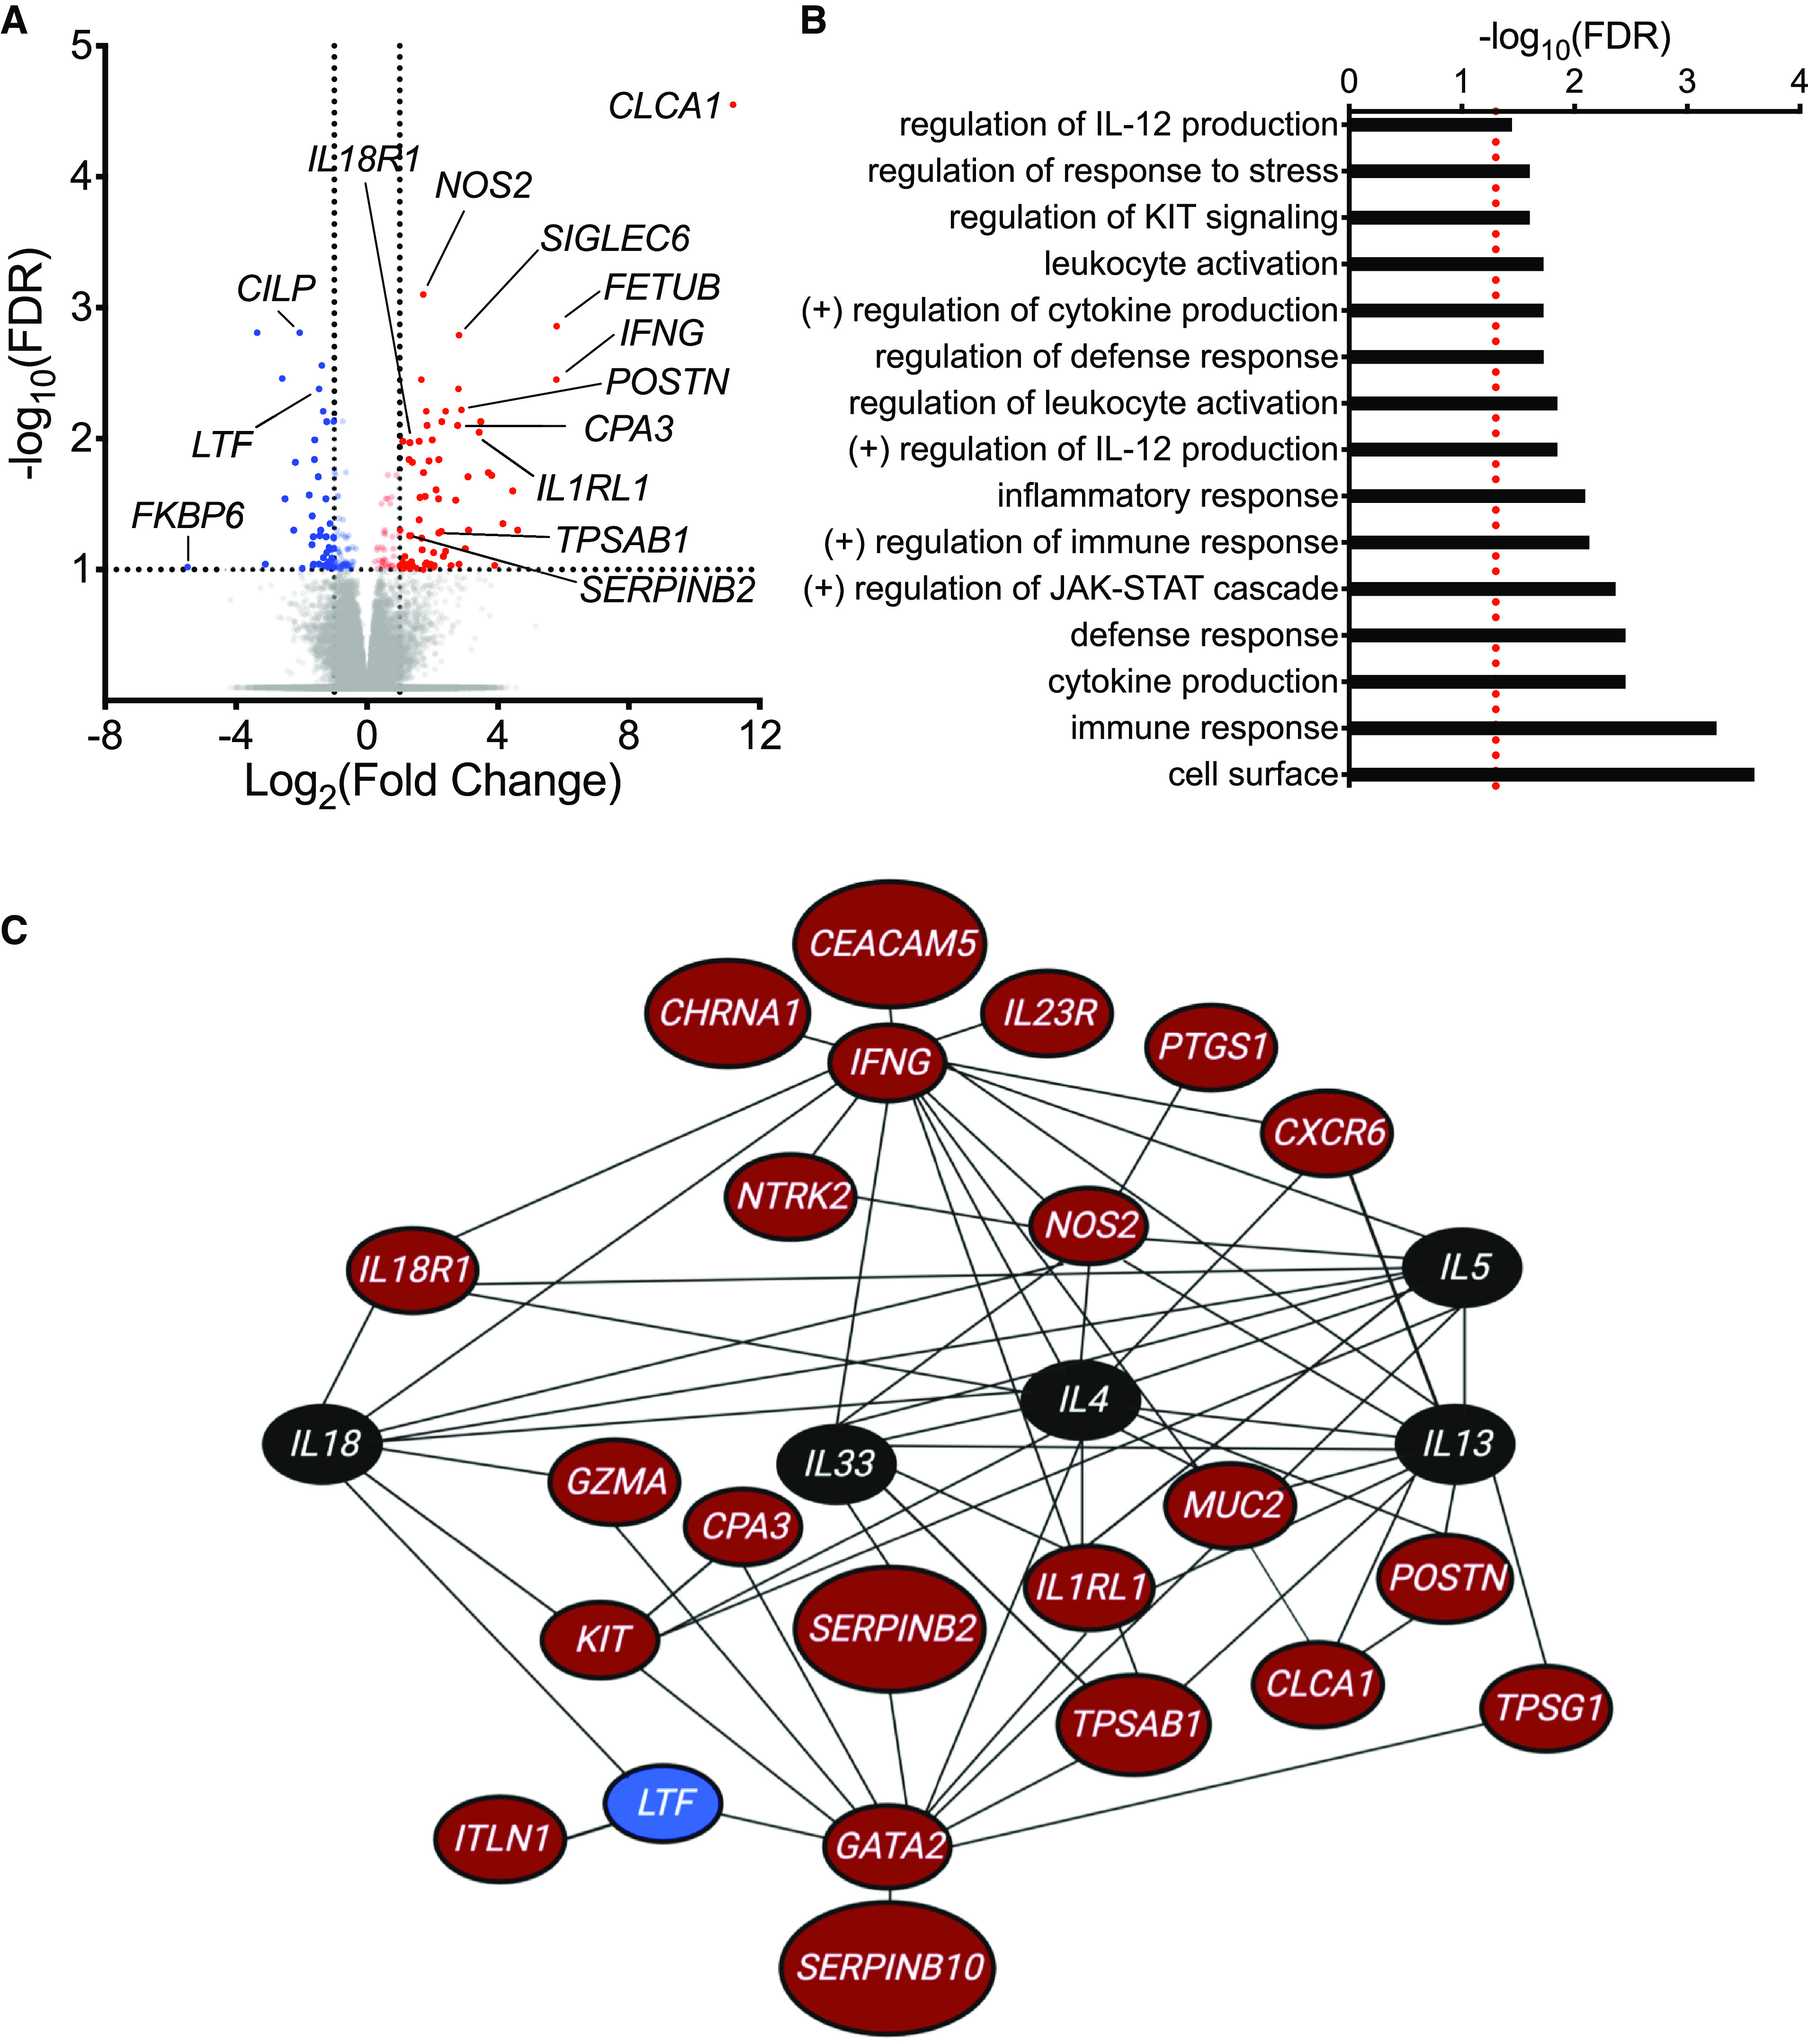
Figure 1.

RNA-sequencing analysis of epithelial brushings obtained from individuals with and without exercise-induced bronchoconstriction (EIB). (A) A volcano plot showing the significance and fold-change differences in gene expression between individuals with and without EIB. Red indicates genes that have significantly higher expression, and blue indicates genes that have significantly lower expression in individuals with EIB. False discovery rate (FDR), <0.1; log2(fold change), ⩾1.0 or ⩽−1.0. (B) Gene Ontology biologic processes, cellular components, and molecular functions as well as pathways from the Kyoto Encyclopedia of Genes and Genomes and Reactome databases that were overrepresented among the 120 differentially expressed genes (DEGs) between asthmatic individuals with and without EIB using WebGestalt (FDR <0.05, represented by a red dashed line). (C) Network analysis of DEGs using Ingenuity Pathway Analysis. Genes indicated in red have significantly higher expression, and genes indicated in blue have significantly lower expression in individuals with EIB relative to individuals without EIB. Genes indicated in black are not DEGs identified in our RNA-sequencing analysis but were added to the network to demonstrate interactions between key cytokines of interest (IL4, IL5, IL13, IL18, and IL33) and DEGs.
