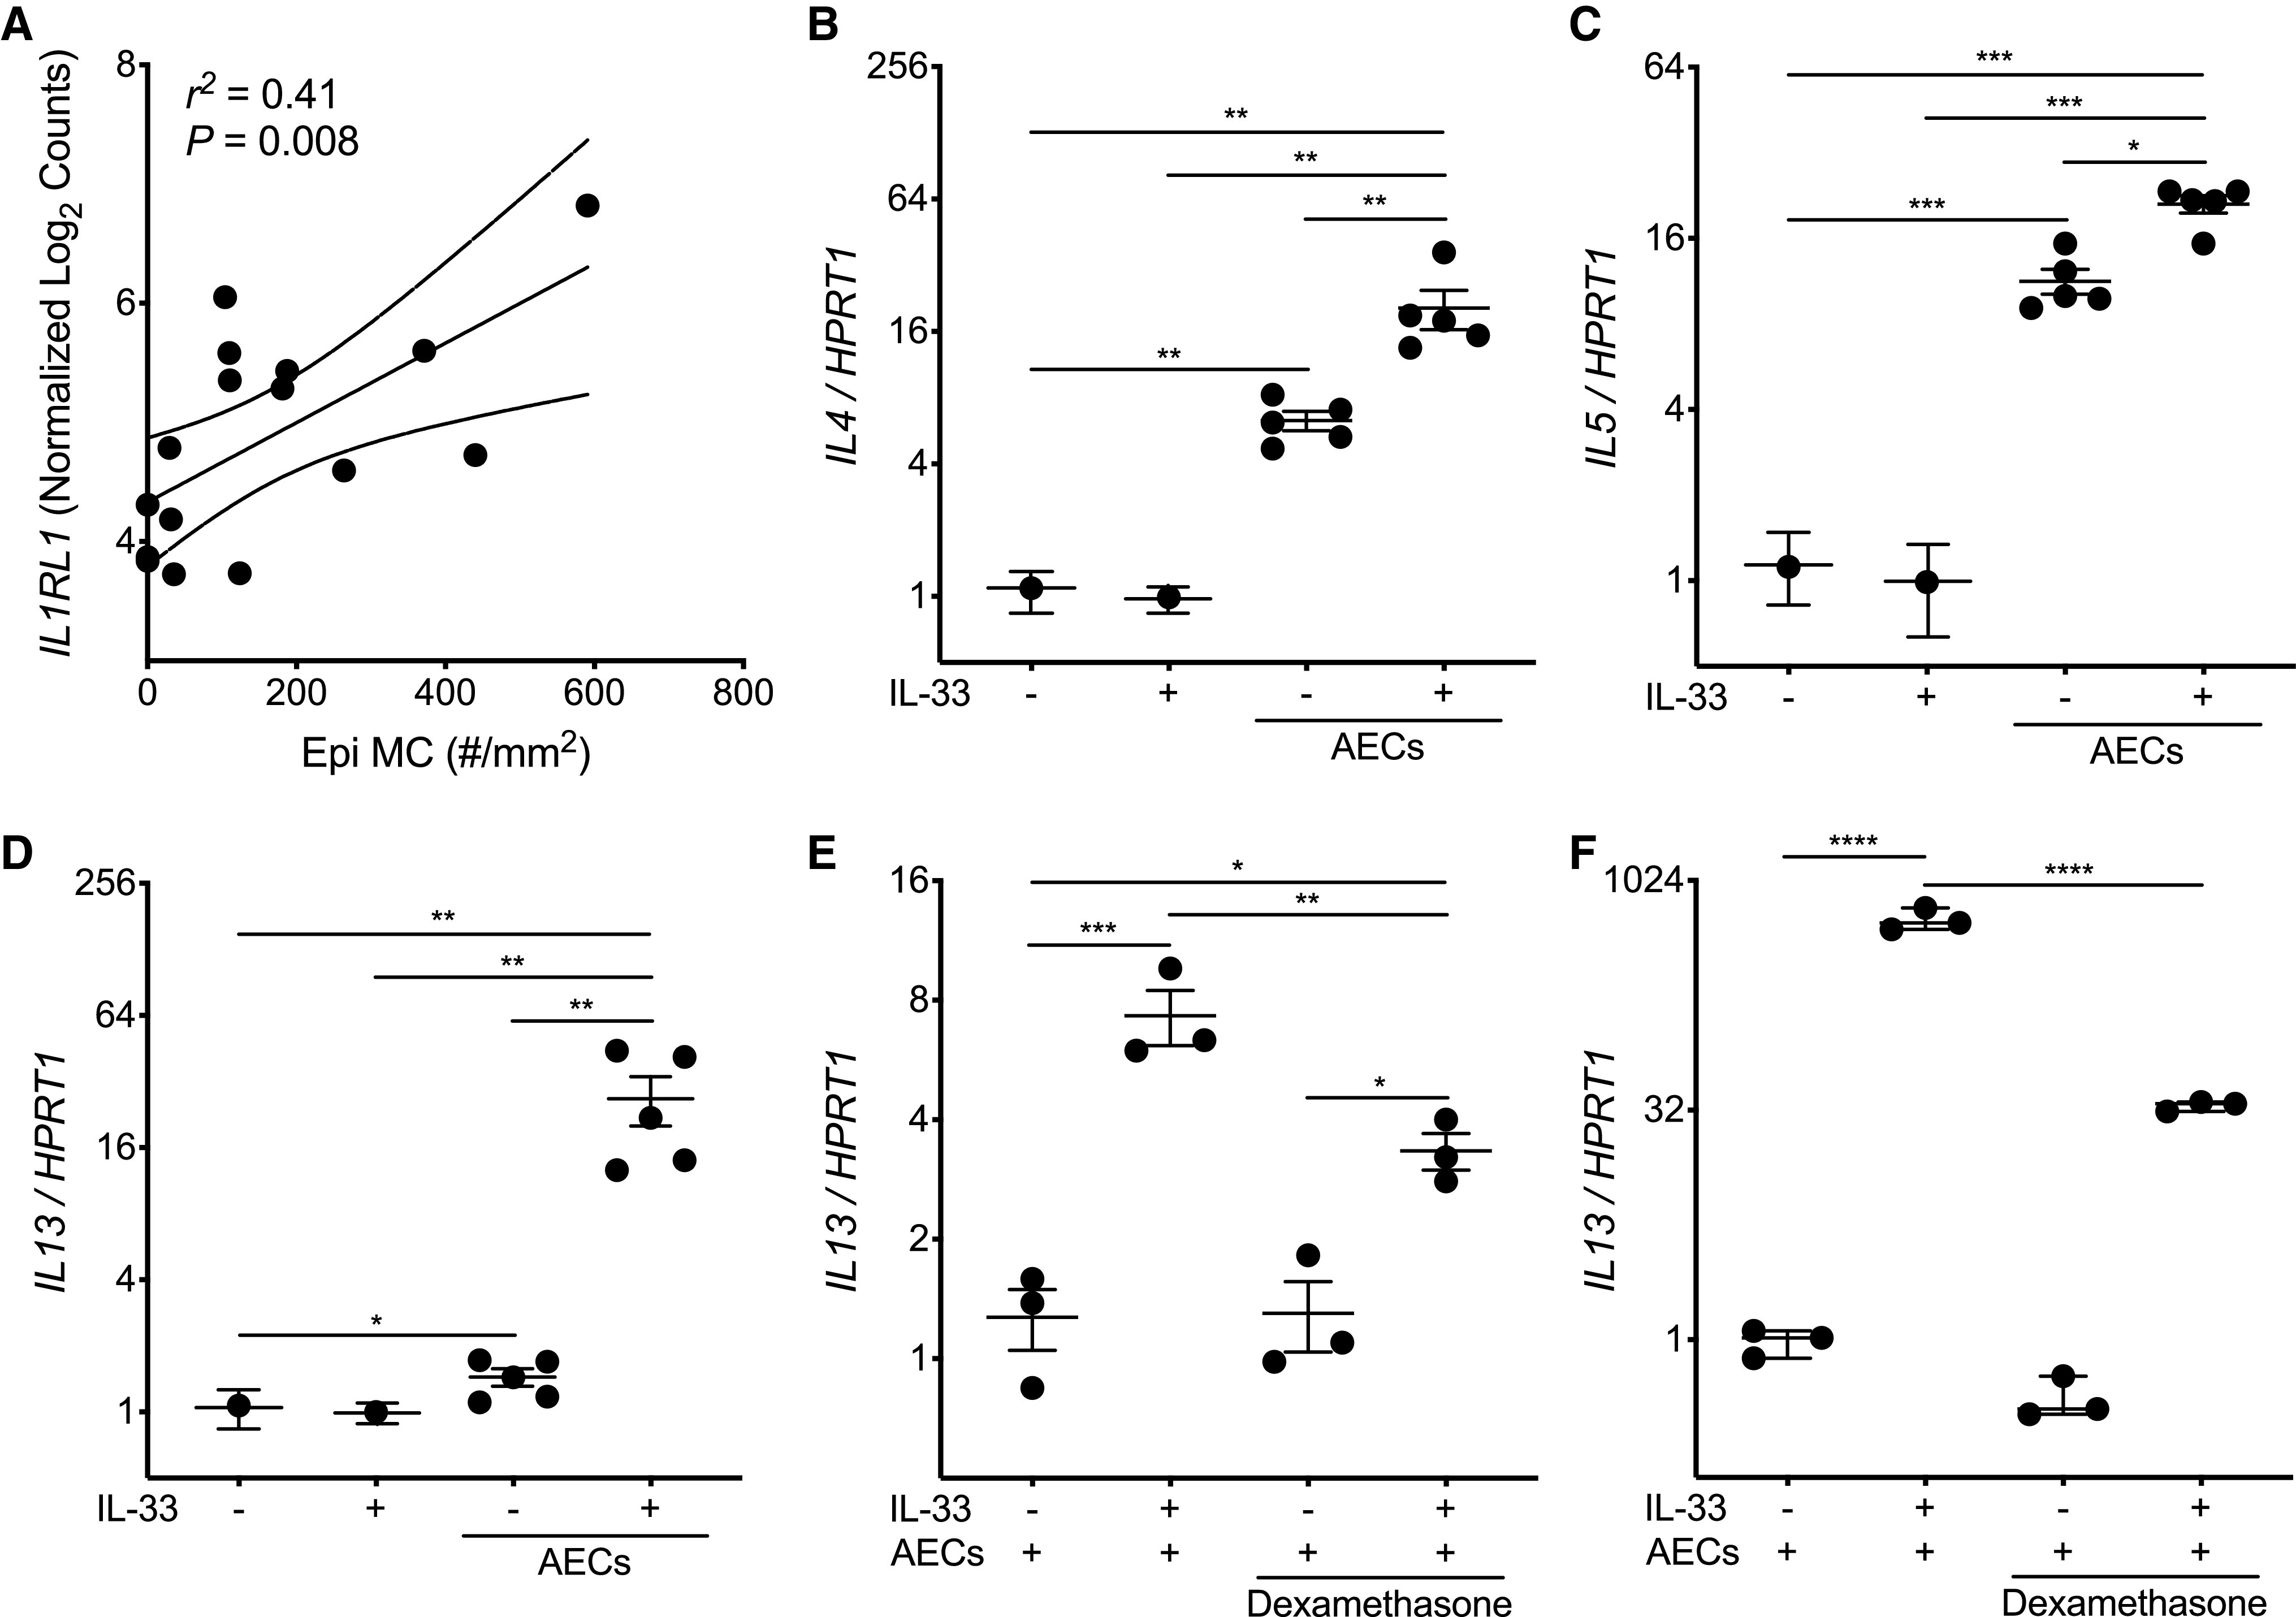
Figure 2.

Airway epithelial cells (AECs) promote mast cell (MC) type-2 (T2) gene expression at baseline and enhance sustained T2 gene expression in response to IL-33. (A) Simple linear regression analysis of the density of MCs in the epithelial compartment (Epi MC) versus IL1RL1 expression identified from the epithelial brushings of matched study participants. A solid linear regression line is shown, with the 95% confidence interval indicated with dotted lines. (B–D) Quantitative PCR analysis for expression of IL4 (B), IL5 (C), and IL13 (D) (in comparison with the housekeeping gene HPRT1) in the Laboratory of Allergic Diseases-2 (LAD2) MCs cultured for 48 hours in the presence or absence of AECs obtained from five healthy adult AEC donors and/or IL-33 (10 ng/ml). Individual data points represent the mean value of four LAD2 MC replicates, and each replicate was the result of three PCR reactions. Thus, data columns with AECs have five individual data points, each representing four LAD2 MC replicates cocultured with a single AEC donor. Mean values are indicated, with error bars representing the SEM. P values represent the result of one-way ANOVAs with repeated measures. (E) Quantitative PCR of LAD2 MCs (n = 4; each replicate was the result of three PCR reactions) cocultured with a single healthy adult AEC donor in the presence of IL-33 (10 ng/ml) or dexamethasone (1 μM). Mean values are indicated, with error bars representing the SEM. P values represent the result of a one-way ANOVA. (F) Human MCs derived from CD34+ cells isolated from the peripheral blood of a single donor were cocultured with primary AECs from a single healthy adult donor for 48 hours in the presence or absence of IL-33 (10 ng/ml) and/or dexamethasone (1 μM). n = 3 per condition, and each data point is the result of three PCR reactions. Mean values are indicated, with error bars representing the SEM. P values represent the result of a one-way ANOVA. *P < 0.05, **P < 0.01, ***P < 0.001, and ****P < 0.0001.
