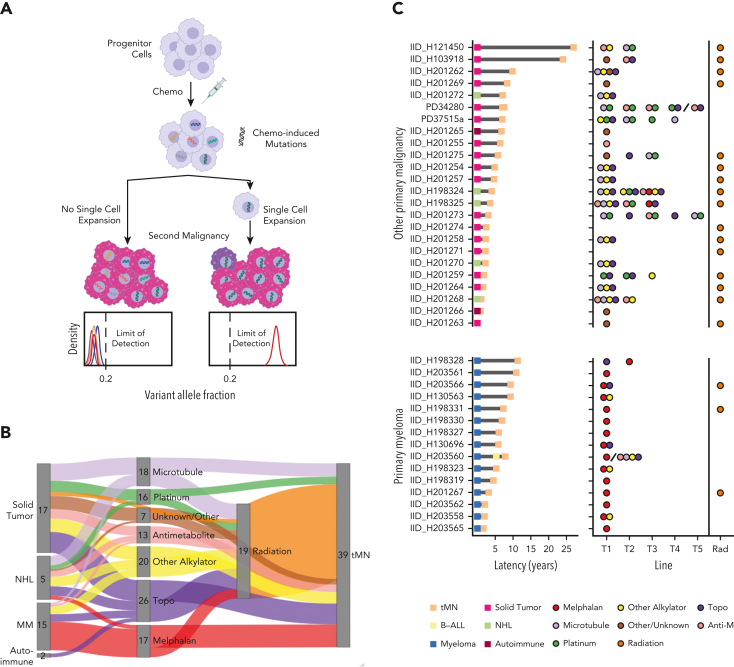
Figure 1.
Chemotherapy-induced mutagenesis and therapy-related myeloid neoplasm WGS cohort. (A) Cartoon summarizing that a single-cell expansion model is required to measure chemotherapy-associated mutational signatures in bulk WGS data. Populations that have already expanded sufficiently will develop private chemotherapy-induced mutations within multiple branching clones. With their expansion in the absence of single-cell expansion, subclonal mutations in each branch have frequencies below the bulk WGS limits of detection. (B) Sankey plot showing the therapeutic relationship between primary diagnosis and tMN. The therapy node cumulatively counts the patient’s exposure to each agent. (C) tMN for which WGS was performed with latency between the primary tumor and the second malignancy (left) and specific chemotherapy exposure (right). Forty tMN from 39 patients visually separated by the primary malignancy diagnosis are included. The line of therapy (ie, the order of treatment) is plotted on the x-axis. The backslashes separate sequential samples from the same patient. Anti-M, antimetabolite.

