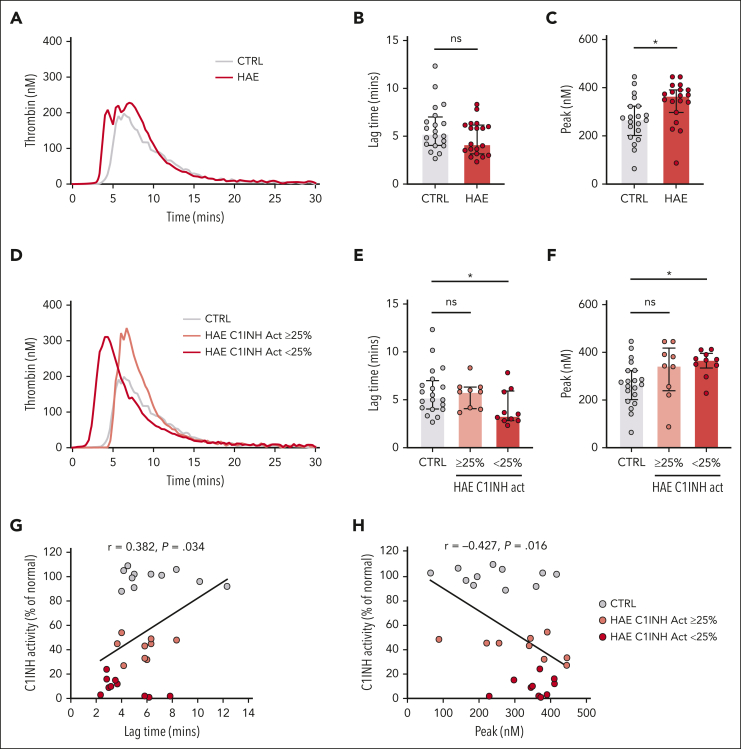
Figure 1.
Increased contact pathway–initiated TG in C1INH-HAE plasma. (A) Median silica-initiated TG curves in plasma from patients with C1INH-HAE (n = 19) or matched controls (n = 20) with quantification of (B) TG lag time and (C) peak TG. (D) Median silica-initiated TG curves in plasma from patients with C1INH-HAE with ≥25% C1INH activity (n = 9), <25% C1INH activity (n = 10), and in matched controls (n = 20) with quantification of TG (E) lag time and (F) peak. Data are represented as individual values with median and interquartile range and analyzed by Kruskal-Wallis with post hoc Dunn’s. Plots of TG (G) lag time and (H) peak vs C1INH activity in plasma from patients with C1INH-HAE and matched controls. Data are represented as individual values with linear regression line. Correlations analyzed using Spearman rank tests. ∗P < .05,

