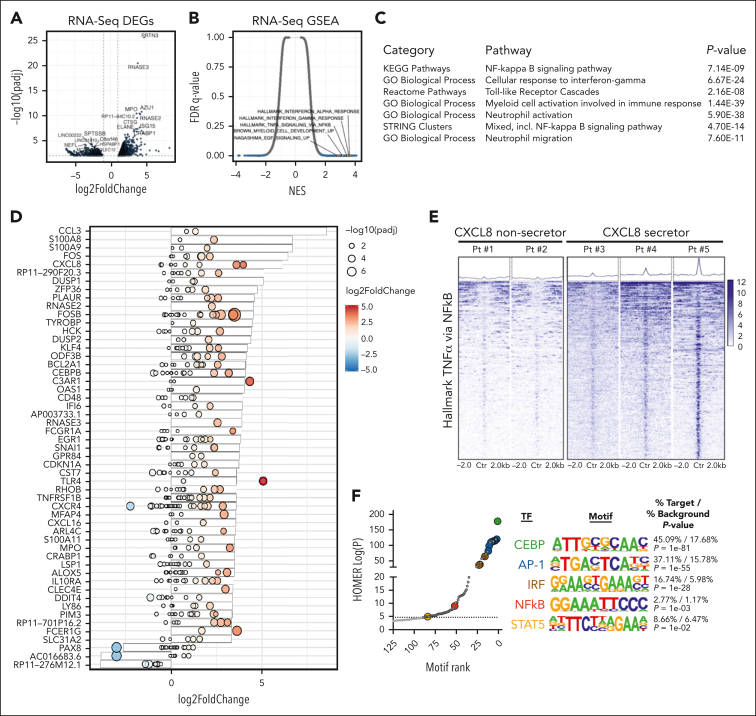
Figure 2.
Integrated transcriptional (RNA-Seq)/chromatin accessibility (ATAC-Seq) profiling identifies pathways enriched in CXCL8-secretor MF. (A) Volcano plot demonstrating most DEGs in CXCL8 secretor (N = 3) vs nonsecretor (N = 5) patients with MPN via RNA-Seq. The significant events with an inclusion level >0.5 log fold change and an FDR-corrected P < .0001 are shown in blue. (B) GSEA demonstrating enriched pathways of CXCL8 secretors vs nonsecretors plotted as NES vs FDR q value. (C) Table depicting results of enriched pathways from optimized subnetwork gene expression analysis in CXCL8 secretor vs nonsecretor patients with MPN. (D) Waterfall plot with integrated gene expression and chromatin accessibility showing most differentially regulated genes (represented as log2 fold change) in CXCL8 secretors (N = 3) vs nonsecretors (N = 2) and their corresponding degree of changes in accessibility peaks (represented as log2 fold change and -log10[padj]; red, positive values; blue, negative values). (E) Tornado plot and heatmaps depicting accessibility at promoter regions of the top 500 leading-edge genes in the hallmark TNFα/NF-κB gene set of CXCL8 nonsecretor (N = 2) vs CXCL8-secretor (N = 3) patients with MPN. (F) Known Homer motif analysis from ATAC-Seq data demonstrating increased accessibility of CEBP, AP-1 (and AP-1 related), interferon-regulatory factor (and interferon-regulatory factor–related), NF-κB, and STAT5 motif signatures among enhancer regions of CXCL8-high/fibrotic MPN.

